HISTOGRAM Statement: CAPABILITY Procedure

See CAPGOF in the SAS/QC Sample LibraryA weakness of the chi-square goodness-of-fit test is its dependence on the choice of histogram midpoints. An advantage of the EDF tests is that they give the same results regardless of the midpoints, as illustrated in this example.
In Example 5.9, the option MIDPOINTS=0.2 TO 1.8 BY 0.2 was used to specify the histogram midpoints for Gap. The following statements refit the lognormal distribution by using default midpoints (0.3 to 1.8 by 0.3).
ods graphics off;
title1 'Distribution of Plate Gaps';
proc capability data=Plates noprint;
   var Gap;
   specs  lsl = 0.3 llsl = 2  clsl=black
          usl = 0.8 lusl = 20 cusl=black;
   histogram /
       lognormal
       nospeclegend
       vaxis  = axis1;
   inset n mean(5.3) std='Std Dev'(5.3) skewness(5.3)
       / pos = ne  header = 'Summary Statistics';
   axis1 label=(a=90 r=0);
run;
The histogram is shown in Output 5.10.1.
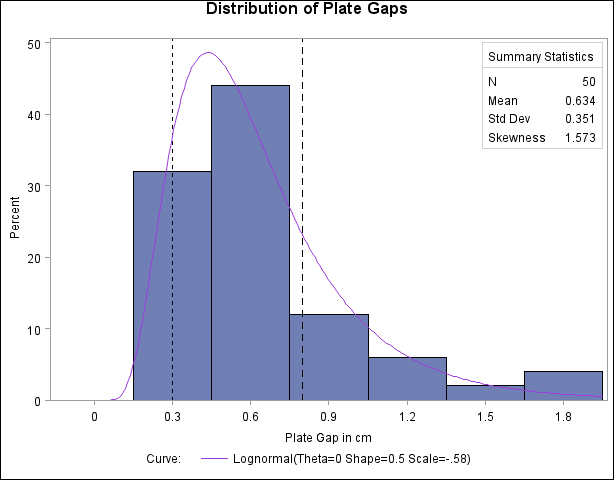
A summary of the lognormal fit is shown in Output 5.10.2. The p-value for the chi-square goodness-of-fit test is 0.082. Since this value is less than 0.10 (a typical cutoff level), the conclusion is that the lognormal distribution is not an appropriate model for the data. This is the opposite conclusion drawn from the chi-square test in Example 5.9, which is based on a different set of midpoints and has a p-value of 0.2756 (see Output 5.9.2). Moreover, the results of the EDF goodness-of-fit tests are the same since these tests do not depend on the midpoints. When available, the EDF tests provide more powerful alternatives to the chi-square test. For a thorough discussion of EDF tests, refer to D’Agostino and Stephens (1986).
Output 5.10.2: Printed Output for the Lognormal Curve
| Distribution of Plate Gaps |
| Parameters for Lognormal Distribution | ||
|---|---|---|
| Parameter | Symbol | Estimate |
| Threshold | Theta | 0 |
| Scale | Zeta | -0.58375 |
| Shape | Sigma | 0.499546 |
| Mean | 0.631932 | |
| Std Dev | 0.336436 | |
| Goodness-of-Fit Tests for Lognormal Distribution | |||||
|---|---|---|---|---|---|
| Test | Statistic | DF | p Value | ||
| Kolmogorov-Smirnov | D | 0.06441431 | Pr > D | >0.150 | |
| Cramer-von Mises | W-Sq | 0.02823022 | Pr > W-Sq | >0.500 | |
| Anderson-Darling | A-Sq | 0.24308402 | Pr > A-Sq | >0.500 | |
| Chi-Square | Chi-Sq | 6.69789360 | 3 | Pr > Chi-Sq | 0.082 |