Dictionary of Options: SHEWHART Procedure
This section provides detailed descriptions of options that you can specify in the following chart statements:
-
BOXCHART
-
CCHART
-
IRCHART
-
MCHART
-
MRCHART
-
NPCHART
-
PCHART
-
RCHART
-
SCHART
-
UCHART
-
XCHART
-
XRCHART
-
XSCHART
Options are specified after the slash (/) in a chart statement. For example, to request tests for special causes with an ![]() and R chart, you can use the TESTS= option as follows:
and R chart, you can use the TESTS= option as follows:
proc shewhart data=Measures;
   xrchart Length*Sample / tests=1 to 4 ;
run;
The options described in this section are listed alphabetically. For tables of options organized by function, see the “Summary of Options” tables in the sections for the various chart statements.
Unless indicated otherwise, the options listed here are available with every chart statement. The notes Traditional Graphics, ODS Graphics, and Line Printer identify options that apply to traditional graphics, ODS Graphics output, and line printer charts, respectively. For statements
that create two charts, the term primary chart refers to the upper chart (for instance, the ![]() chart created with the XRCHART statement), and the term secondary chart refers to the lower chart (for instance, the R chart created with the XRCHART statement). The term primary chart also refers to the single chart created by some statements (for instance, the p chart created with the PCHART statement).
chart created with the XRCHART statement), and the term secondary chart refers to the lower chart (for instance, the R chart created with the XRCHART statement). The term primary chart also refers to the single chart created by some statements (for instance, the p chart created with the PCHART statement).
-
ALLLABEL=VALUE
ALLLABEL=(variable) -
labels every point on the primary chart with the VALUE plotted for that subgroup or with the value of a variable in the input data set.
The variable provided in the input data set can be numeric or character. If the variable is a character variable, its length cannot exceed 16. For each subgroup of observations, the formatted value of the variable in the observations is used to label the point representing the subgroup. If you are reading a DATA= data set with multiple observations per subgroup, the values of the variable should be identical for observations within a subgroup. You should use this option with care to avoid cluttering the chart. By default, points are not labeled. Related options are CFRAMELAB=, OUTLABEL=, LABELFONT=, LABELHEIGHT=, and TESTLABEL=, but note that the OUTLABEL= option cannot be specified with the ALLLABEL= option.
-
ALLLABEL2=VALUE
ALLLABEL2=(variable) -
labels every point on an R, s, or trend chart with the VALUE plotted for that subgroup or with the value of a variable in the input data set.
The variable provided in the input data set can be numeric or character. If the variable is a character variable, its length cannot exceed 16. For each subgroup of observations, the formatted value of the variable in the observations is used to label the point representing the subgroup. If you are reading a DATA= data set with multiple observations per subgroup, the values of the variable should be identical for observations within a subgroup. You should use this option with care to avoid cluttering the chart. By default, points are not labeled. Related options are CFRAMELAB=, OUTLABEL2=, LABELFONT=, LABELHEIGHT=, and TESTLABEL2=, but note that the OUTLABEL2= option cannot be specified with the ALLLABEL2= option. The option is available in the IRCHART, MRCHART, RCHART, SCHART, XRCHART, and XSCHART statements and in the BOXCHART, MCHART, and XCHART statements with the TRENDVAR= option.
- ALLN
-
plots summary statistics for all subgroups, regardless of whether the subgroup sample size equals the nominal control limit sample size n specified by the LIMITN= option or the variable
_LIMITN_in the LIMITS= data set. Use the ALLN option in conjunction with the LIMITN= option or the variable_LIMITN_.The ALLN option is useful in applications where almost all of the subgroups have a common sample size n, and you want to display fixed (rather than varying) control limits corresponding to the nominal sample size n. The disadvantage of using the ALLN option with widely differing subgroup sample sizes is that the interpretation of the control limits is meaningful only for those subgroups whose sample size is equal to n. To request special symbol markers indicating that not all the sample sizes are equal to n, use the NMARKERS option in conjunction with the ALLN option.
The ALLN option is not available in the IRCHART statement.
- ALPHA=value
-
requests probability limits. If you specify ALPHA=
 , the control limits are computed so that the probability is that a subgroup summary statistic exceeds its control limits. This assumes that the process is in statistical control and
that the data follow a certain theoretical distribution, which depends on the chart statement. The Poisson distribution is
assumed for the CCHART and UCHART statements, and the binomial distribution is assumed for the NPCHART and PCHART statements.
The normal distribution is assumed for all other chart statements. For the equations used to compute probability limits, see
the “Details” subsection in the section for the chart statement that you are using.
, the control limits are computed so that the probability is that a subgroup summary statistic exceeds its control limits. This assumes that the process is in statistical control and
that the data follow a certain theoretical distribution, which depends on the chart statement. The Poisson distribution is
assumed for the CCHART and UCHART statements, and the binomial distribution is assumed for the NPCHART and PCHART statements.
The normal distribution is assumed for all other chart statements. For the equations used to compute probability limits, see
the “Details” subsection in the section for the chart statement that you are using.
The value of
can range between 0 and 1 for most statements. However, for the MCHART statement, the MRCHART statement, and the BOXCHART
statement with the CONTROLSTAT=MEDIAN option, the value of must be one of the following: 0.001, 0.002, 0.01, 0.02, 0.025, 0.04, 0.05, 0.10, or 0.20.
Note the following:
-
As an alternative to specifying ALPHA=
, you can read from the variable _ALPHA_in a LIMITS= data set by specifying the READALPHA option. See “Input Data Sets” in the section for the chart statement in which you are interested. -
As an alternative to specifying ALPHA=
(or reading the variable _ALPHA_from a LIMITS= data set), you can request “ control limits” by specifying SIGMAS=k (or reading the variable
 _SIGMAS_from a LIMITS= data set).
If you specify neither the ALPHA= option nor the SIGMAS= option, the procedure computes
 control limits by default.
-
-
ANNOTATE=SAS-data-set
ANNO=SAS-data-set -
Traditional Graphicsspecifies an ANNOTATE= type data set, as described in SAS/GRAPH: Reference, that enhances a primary chart. The ANNOTATE= data set specified in a chart statement enhances all charts created by that particular statement. You can also specify an ANNOTATE= data set in the PROC SHEWHART statement to enhance all primary charts created by the procedure.
-
ANNOTATE2=SAS-data-set
ANNO2=SAS-data-set -
Traditional Graphicsspecifies an ANNOTATE= type data set, as described in SAS/GRAPH: Reference, that enhances a secondary chart. The ANNOTATE2= data set specified in a chart statement enhances all charts created by that particular statement. You can also specify an ANNOTATE2= data set in the PROC SHEWHART statement to enhance all secondary charts created by the procedure.
This option is available in the IRCHART, MRCHART, XRCHART, and XSCHART statements and in the BOXCHART, MCHART, and XCHART statements with the TRENDVAR= option.
- BILEVEL
-
Traditional GraphicsLine Printerarranges the Shewhart chart in two levels (rather than the default of one level) so that twice as much data can be displayed on a page or screen. The second level is a continuation of the first level, and this arrangement is continued on subsequent pages until all the subgroups are displayed. You use the NPANELPOS= option to control the number of subgroup positions in each level. If you specify the BILEVEL option in a chart statement that produces primary and secondary charts, you must also specify the SEPARATE option.
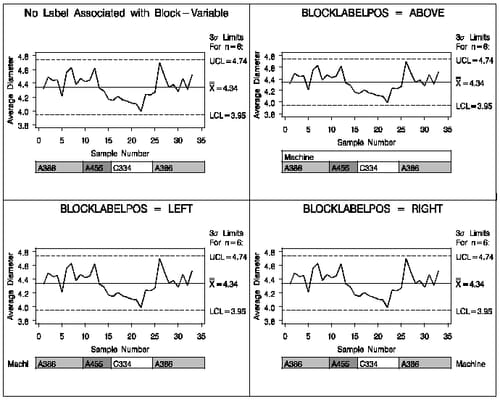
- BLOCKLABELPOS=ABOVE | LEFT | RIGHT
-
specifies the position of a block-variable label in the block legend. As shown in Figure 17.129, the keyword ABOVE places the label immediately above the legend, LEFT places the label to the left of the legend, and RIGHT places the label to the right of the legend. Use the keywords LEFT and RIGHT with labels that are short enough to fit in the margins on each side of the chart; otherwise, they will be truncated. Use the keyword RIGHT only when the legend is below the control chart (BLOCKPOS=3 or BLOCKPOS=4). The default keyword is ABOVE. Related options are BLOCKLABTYPE=, BLOCKREP, BLOCKPOS=, CBLOCKVAR=, and CBLOCKLAB=.
Figure 17.129: Positions for block-variable Labels
-
BLOCKLABTYPE=SCALED | TRUNCATED | ROTATE | ROTATEALL
BLOCKLABTYPE=height -
Traditional GraphicsODS Graphicsspecifies how lengthy block variable values are to be treated when there is insufficient space to display them in the block legend. By default, lengthy values are not displayed.
If you specify the BLOCKLABTYPE=SCALED option, the values are uniformly reduced in height so that they fit. If you specify the BLOCKLABTYPE=TRUNCATED option, lengthy values are truncated on the right until they fit. When producing traditional graphics, you can also specify a text height in vertical percent screen units for the values. For ODS Graphics output, you can specify BLOCKLABTYPE=ROTATE to rotate the values of the block variable displayed closest to the chart by 90 degrees, and BLOCKLABTYPE=ROTATEALL to rotate the values of all block variables. Related options are BLOCKLABELPOS=, BLOCKREP, BLOCKPOS=, CBLOCKVAR=, and CBLOCKLAB=.
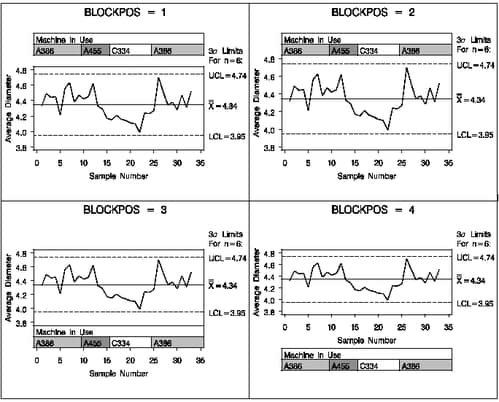
- BLOCKPOS=n
-
specifies the vertical position of the legend for the values of the block-variables (see Displaying Stratification in Blocks of Observations). Values of n and the corresponding positions are as follows. By default, BLOCKPOS=1.
n
Legend Position
1
Top of chart, offset from axis frame
2
Top of chart, immediately above axis frame
3
Bottom of chart, immediately above horizontal axis
4
Bottom of chart, below horizontal axis label
Figure 17.130 illustrates the various positions that can be specified.
Figure 17.130: Positions for block-variable Legends
Related options are BLOCKLABELPOS=, BLOCKLABTYPE=, BLOCKREP, CBLOCKVAR=, and CBLOCKLAB=.
-
BLOCKREFTRANSPARENCY=value
PHASEREFTRANSPARENCY=value -
- REFFILLTRANSPARENCY=value
-
ODS Graphicsspecifies the wall fill transparency for blocks and phases when transparency is used in ODS Graphics output. The value must be between 0 and 1, where 0 is completely opaque and 1 is completely transparent. The default wall fill transparency is 0.85.
- BLOCKREP
-
specifies that block variable values for all subgroups are to be displayed. By default, only the first block variable value in any block is displayed, and repeated block variable values are not displayed. Related options are BLOCKLABELPOS=, BLOCKLABTYPE=, BLOCKPOS=, CBLOCKVAR=, and CBLOCKLAB=. For more information about block variables, see Displaying Stratification in Blocks of Observations.
- BLOCKVAR=variable | (variable-list)
-
Traditional GraphicsODS Graphicsspecifies variables whose values are used to assign colors for filling the background of the legend associated with block variables. A list of BLOCKVAR= variables must be enclosed in parentheses. BLOCKVAR= variables are matched with block variables by their order in the respective variable lists. While the values of a CBLOCKVAR= variable are color names, values of a BLOCKVAR= variable are used to group block legends for assigning fill colors from the ODS style. Block legends with the same BLOCKVAR= variable value are filled with the same color.
-
BOXCONNECT
BOXCONNECT=MEAN | MEDIAN | MAX | MIN | Q1 | Q3 -
specifies that the points representing subgroup means, medians, maximum values, minimum values, first quartiles or third quartiles in box-and-whisker plots created with the BOXCHART statement are to be connected. If BOXCONNECT is specified without a keyword identifying the points to be connected, subgroup means are connected. By default, no points are connected. The BOXCONNECT option is available only in the BOXCHART statement.
- BOXES=variable
-
Traditional GraphicsODS Graphicsspecifies a variable whose values are used to assign colors for the outlines of box-and-whiskers plots. While the values of a CBOXES= variable are color names, values of the BOXES= variable are used to group box-and-whiskers plots for assigning outline colors from the ODS style. The outlines of box-and-whiskers plots of groups with the same BOXES= variable value are drawn using the same color.
- BOXFILL=variable | NONE | EMPTY
-
Traditional GraphicsODS Graphicsspecifies how box-and-whisker plots are filled with colors from the ODS style. You can specify a variable whose values are used to group box-and-whiskers plots for assigning fill colors from the ODS style. Boxes associated with groups having the same BOXFILL= variable value are filled with the same color. You can specify the keyword NONE or EMPTY to produce unfilled boxes. When producing traditional graphics, you can use the CBOXFILL= option to select specific colors for filling the boxes. By default, all boxes are filled with a single color from the ODS style.
- BOXTRANSPARENCY=value
-
ODS Graphicsspecifies the box fill transparency for box-and-whisker charts when transparency is used in ODS Graphics output. The value must be between 0 and 1, where 0 is completely opaque and 1 is completely transparent. The default box fill transparency is 0.25.
- BOXSTYLE=keyword
-
specifies the style of the box-and-whisker plots that are displayed for subgroup samples by the BOXCHART statement.
The SKELETAL, SCHEMATIC, SCHEMATICID, and SCHEMATICIDFAR keywords are useful for creating conventional box-and-whisker displays. The keywords POINTS, POINTSJOIN, POINTSBOX, POINTSID, and POINTSJOINID are used to generalize the BOXSTYLE= option and, in particular, to facilitate the creation of so-called “multi-vari” charts, as illustrated in Output 17.7.2 and Output 17.7.3. The keyword POINTSSCHEMATIC combines the POINT and SCHEMATIC boxstyles.
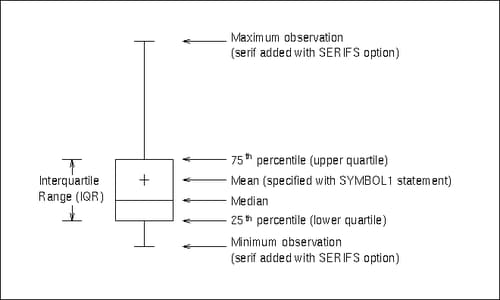
If you specify BOXSTYLE=SKELETAL, the whiskers are drawn from the edges of the box to the extreme values of the subgroup sample. This plot is sometimes referred to as a skeletal box-and-whisker plot. By default, the whiskers are drawn without serifs, but you can add serifs with the SERIFS option. Figure 17.131 illustrates the elements of a typical skeletal boxplot.
Figure 17.131: BOXSTYLE= SKELETAL
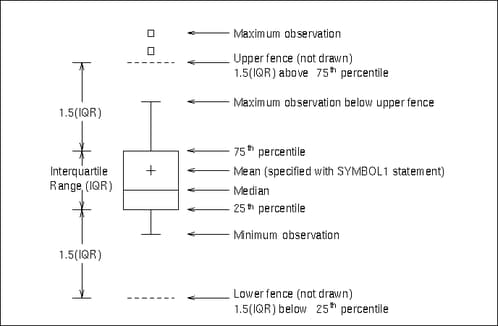
If you specify BOXSTYLE=SCHEMATIC, a whisker is drawn from the upper edge of the box to the largest value within the upper fence and from the lower edge of the box to the smallest value within the lower fence. Figure 17.132 illustrates a typical schematic boxplot and the locations of the fences (which are not displayed in actual output). Serifs are added to the whiskers by default. Observations outside the fences are identified with a special symbol; you can specify the shape and color for this symbol with the IDSYMBOL= and IDCOLOR= options. The default symbol is a square. This type of plot corresponds to the schematic box-and-whisker plot described in Chapter 2 of Tukey (1977).
If you specify BOXSTYLE=SCHEMATICID, a schematic box-and-whisker plot is displayed in which the value of the first variable listed in the ID statement is used to label the symbol marking each observation outside the upper and lower fences.
If you specify BOXSTYLE=SCHEMATICIDFAR, a schematic box-and-whisker plot is displayed in which the value of the first variable listed in the ID statement is used to label the symbol marking each observation outside the lower and upper far fences. The lower and upper far fences are located
 IQR below the 25th percentile and above the 75th percentile, respectively. Observations between the fences and the far fences
are identified with a symbol but are not labeled with the ID variable.
IQR below the 25th percentile and above the 75th percentile, respectively. Observations between the fences and the far fences
are identified with a symbol but are not labeled with the ID variable.
Figure 17.132: BOXSTYLE= SCHEMATIC
Note: To make side-by-side box charts (as opposed to a control chart with subgroup box plots), you should use the BOXCHART statement with the NOLIMITS option in addition to the BOXSTYLE= option.
If you specify BOXSTYLE=POINTS, Traditional Graphicsall the values in the subgroup sample are plotted as points, and neither a box nor whiskers are drawn. By default, a square plotting symbol is used for the values. You can specify a symbol with the IDSYMBOL= option. You can specify the color of the symbols with the IDCOLOR= option (the default color is the color specified with the CBOXES= option).
If you specify BOXSTYLE=POINTSJOIN, Traditional Graphicsall the values in the subgroup sample are plotted as points joined with a vertical line. Neither a box nor whiskers are drawn. See Output 17.7.2 for an illustration. By default, a square plotting symbol is used for the values. You can specify a symbol with the IDSYMBOL= option, and you can specify the color of the symbol with the IDCOLOR= option. You can specify the color of the vertical line with the CBOXES= option.
If you specify BOXSTYLE=POINTSBOX, Traditional Graphicsall the values in the subgroup sample are plotted as points enclosed in a box. By default, a square plotting symbol is used for the values. You can specify a symbol with the IDSYMBOL= option, and you can specify the color of the symbol with the IDCOLOR= option. You can specify the color of the box with the CBOXES= option, the fill color of the box with the CBOXFILL= option, and the line type of the box with the LBOXES= option.
If you specify BOXSTYLE=POINTSID, Traditional Graphicsall the values in the subgroup sample are plotted using labels specified as the values of the first variable in the ID statement. See Output 17.7.3 for an illustration. It is recommended that you use single-character labels. You can specify a font for the labels with the IDFONT= option. You can specify the height of the labels with the IDHEIGHT= option. You can specify the color of the labels with the IDCTEXT= option.
If you specify BOXSTYLE=POINTSJOINID, Traditional Graphicsall the values in the subgroup sample are plotted using labels specified as the values of the first variable in the ID statement, and the values are joined by a vertical line. It is recommended that you use single-character labels. You can specify a font for the labels with the IDFONT= option. You can specify the height of the labels with the IDHEIGHT= option. You can specify the color of the labels with the IDCTEXT= option, and you can specify the color of the vertical line with the CBOXES= option.
If you specify BOXSTYLE=POINTSSCHEMATIC, Traditional Graphicsa schematic box chart is overlaid with points plotting all observations in the subgroups.
The BOXSTYLE= option is available only in the BOXCHART statement; see Example 17.2. The styles SCHEMATIC, SCHEMATICID, and SCHEMATICIDFAR are available only when the input data set is a DATA= data set. By default, BOXSTYLE= SKELETAL. Related options include BOXWIDTH=, BOXWIDTHSCALE=, IDCOLOR=, and IDSYMBOL=.
Note that the keywords POINTS, POINTSJOIN, POINTSBOX, POINTSID, and POINTSJOINID for the BOXSTYLE= option can be used in conjunction with the CPHASEBOX=, CPHASEBOXFILL=, CPHASEBOXCONNECT=, CPHASEMEANCONNECT=, and PHASEMEANSYMBOL= options to create “multi-vari” displays.
- BOXWIDTH=value
-
Traditional GraphicsODS Graphicsspecifies the width of box-and-whisker plots created with the BOXCHART statement. For traditional graphics, the width is specified in horizontal percent screen units. For ODS Graphics output, the width is specified in pixels. The default width is chosen so that the boxes are as wide as possible without colliding. You should use the BOXWIDTH= option in situations where the number of subgroups per panel is very small and you want to reduce the width. The BOXWIDTH= option is available only in the BOXCHART statement.
- BOXWIDTHSCALE=value
-
Traditional GraphicsODS Graphicsspecifies that the width of box-and-whisker plots created with the BOXCHART statement is to vary proportionately to a particular function of the subgroup sample size n. The function is determined by the value and is identified on the chart with a legend.
If you specify a positive value, the widths are proportional to
 . In particular, if you specify BOXWIDTHSCALE=1, the widths are proportional to the sample size. If you specify BOXWIDTHSCALE=0.5,
the widths are proportional to
. In particular, if you specify BOXWIDTHSCALE=1, the widths are proportional to the sample size. If you specify BOXWIDTHSCALE=0.5,
the widths are proportional to  , as described by McGill, Tukey, and Larsen (1978). If you specify BOXWIDTHSCALE=0, the widths are proportional to
  . See Example 17.4 for an illustration of the BOXWIDTHSCALE= option.
By default, the box widths are constant. The BOXWIDTHSCALE= option is available only in the BOXCHART statement.
-
CAXIS=color
CAXES=color
CA=color -
Traditional Graphicsspecifies the color for the axes and tick marks. This option overrides any COLOR= specifications in an AXIS statement.
- CBLOCKLAB=color | (color-list)
-
Traditional Graphicsspecifies fill colors for the frames that enclose the block-variable labels in a block legend. By default, these areas are not filled. Colors in the CBLOCKLAB= list are matched with block-variables in the order in which they appear in the chart statement. Related options are BLOCKLABELPOS=, BLOCKLABTYPE=, BLOCKREP, BLOCKPOS=, and CBLOCKVAR=.
- CBLOCKVAR=variable | (variable-list)
-
Traditional Graphicsspecifies variables whose values are colors for filling the background of the legend associated with block-variables. Each CBLOCKVAR= variable must be a character variable of no more than eight characters in the input data set (a DATA=, HISTORY=, or TABLE= data set). A list of CBLOCKVAR= variables must be enclosed in parentheses. You can use the BLOCKVAR= option to specify that the block variable legend be filled with different colors from the ODS style.
The procedure matches the CBLOCKVAR= variables with block-variables in the order specified. That is, each block legend will be filled with the color value of the CBLOCKVAR= variable of the first observation in each block. In general, values of the ith CBLOCKVAR= variable are used to fill the block of the legend corresponding to the ith block-variable. For examples of the CBLOCKVAR= option, see Figure 17.145 and Figure 17.146.
By default, fill colors are not used for the block-variable legend. The CBLOCKVAR= option is available only when block-variables are used in the chart statement.
-
CBOXES=color
CBOXES=(variable) -
Traditional Graphicsspecifies the colors for the outlines of the box-and-whisker plots created with the BOXCHART statement. You can use one of the following approaches:
-
You can specify CBOXES=color to provide a single outline color for all the box-and-whisker plots.
-
You can specify CBOXES=(variable) to provide a distinct outline color for each box-and-whisker plot as the value of the variable. The variable must be a character variable of length 8 less in the input data set, and its values must be valid SAS/GRAPH color names. The outline color of the plot displayed for a particular subgroup is the value of the variable in the observations corresponding to this subgroup. Note that if there are multiple observations per subgroup in the input data set, the values of the variable should be identical for all the observations in a given subgroup.
You can use the BOXES= option to group boxes to be drawn with different colors from the ODS style.
The CBOXES= option is available only in the BOXCHART statement.
-
-
CBOXFILL=color
CBOXFILL=(variable) -
Traditional Graphicsspecifies the interior fill colors for the box-and-whisker plots created with the BOXCHART statement. You can use one of the following approaches:
-
You can specify CBOXFILL=color to provide a single color for all of the box-and-whisker plots.
-
You can specify CBOXFILL=(variable) to provide a distinct color for each box-and-whisker plot as the value of the variable. The variable must be a character variable of length 8 or less in the input data set, and its values must be valid SAS/GRAPH color names (or the value EMPTY, which you can use to suppress color filling). The interior color of the plot displayed for a particular subgroup is the value of the variable in the observations corresponding to this subgroup. Note that if there are multiple observations per subgroup in the input data set, the values of the variable should be identical for all the observations in a given subgroup.
You can use the BOXFILL= option to group boxes to be filled with different colors from the ODS style. By default, all boxes are filled with a single color from the ODS style. The CBOXFILL= option is available only in the BOXCHART statement.
-
- CCLIP=color
-
Traditional Graphicsspecifies a color for the plotting symbol that is specified with the CLIPSYMBOL= option to mark clipped points. The default color is the color specified in the COLOR= option in the SYMBOL1 statement.
- CCONNECT=color
-
Traditional Graphicsspecifies the color for the line segments connecting points on the chart. The default color is the color specified in the COLOR= option in the SYMBOL1 statement. This option is not applicable in the BOXCHART statement unless you also specify the BOXCONNECT option.
- CCOVERLAY=(color-list)
-
Traditional Graphicsspecifies the colors for the line segments connecting points on primary chart overlays. Colors in the CCOVERLAY= list are matched with variables in the corresponding positions in the OVERLAY= list. By default, points are connected by line segments of the same color as the plotted points. You can specify the value NONE to suppress the line segments connecting points on an overlay.
- CCOVERLAY2=(color-list)
-
Traditional Graphicsspecifies the colors for the line segments connecting points on secondary chart overlays. Colors in the CCOVERLAY2= list are matched with variables in the corresponding positions in the OVERLAY2= list. By default, points are connected by line segments of the same color as the plotted points. You can specify the value NONE to suppress the line segments connecting points on an overlay.
-
CFRAME=color
CFRAME=(color-list) -
Traditional Graphicsspecifies the colors for filling the rectangle enclosed by the axes and the frame. By default, this area is not filled. The CFRAME= option cannot be used in conjunction with the NOFRAME option.
You can specify a single color to fill the entire area. Alternatively, if you are displaying phases (blocks) of data read with the READPHASES= option, you can specify a color-list with the CFRAME= option to fill the sub-rectangles of the framed area corresponding to the phases. The colors, in order of specification, are applied to the sub-rectangles starting from left to right. You can use the value EMPTY in the color-list to avoid filling a particular sub-rectangle. If the number of colors is less than the number of phases, the colors are applied cyclically. The colors are also used for phase legends requested with the PHASELEGEND option.
-
CFRAMELAB=color
CFRAMELAB -
Traditional GraphicsODS Graphicsspecifies the color for filling rectangles that frame the point labels displayed with the ALLLABEL=, ALLLABEL2=, OUTLABEL=, and OUTLABEL2= options. Specify CFRAMELAB with no argument to produced unfilled frames. By default, the points are not framed.
- CGRID=color
-
Traditional Graphicsspecifies the color for the grid requested by the ENDGRID or GRID option. By default, the grid is the same color as the axes.
- CHREF=color
-
Traditional Graphicsspecifies the color for the lines requested by the HREF= and HREF2= options.
- CIINDICES <(<TYPE=keyword> <ALPHA=value>)>
-
requests capability index confidence limits based on subgroup summary data, calculated using “effective degrees of freedom” as described by Bissell (1990). These confidence limits are approximate. When you specify the CIINDICES option, the calculated confidence limits are available for display in an inset and are included in the OUTLIMITS= data set, if one is produced.
- TYPE=keyword
-
specifies the type of confidence limit. Valid values are LOWER, UPPER and TWOSIDED. The default value is TWOSIDED.
- ALPHA=value
-
specifies the default confidence level to compute confidence limits. The percentage for the confidence limits is
 . For example, ALPHA=.05 results in a 95% confidence limit. The default value is .05 and the possible range of values is from
0 to 1.
. For example, ALPHA=.05 results in a 95% confidence limit. The default value is .05 and the possible range of values is from
0 to 1.
- CINFILL=color | EMPTY | NONE
-
Traditional GraphicsODS Graphicsspecifies the color for the area inside the upper and lower control limits. By default, this area filled with an appropriate color from the ODS style. You can specify the keyword EMPTY or NONE to leave the area between the contol limits unfilled. See also the COUTFILL= option.
- CLABEL=color
-
Traditional Graphicsspecifies the color for labels produced by the ALLLABEL=, ALLLABEL2=, OUTLABEL=, and OUTLABEL2= options.
- CLIMITS=color
-
Traditional Graphicsspecifies the color for the control limits, the central line, and the labels for these lines.
- CLIPCHAR='character'
-
Line Printerspecifies a plot character that identifies clipped points, as requested with the CLIPFACTOR= option. Specifying the CLIPCHAR= option is recommended when the CLIPFACTOR= option is used. The default character is an asterisk (*).
- CLIPFACTOR=factor
-
requests clipping of extreme points on the control chart. The factor that you specify determines the extent to which these values are clipped, and it must be greater than one (useful values are in the range 1.5 to 2).
For examples of the CLIPFACTOR= option, see Figure 17.169 and Figure 17.170. The CLIPFACTOR= option should not be used in any statement in which the STARVERTICES= option is also used. Related clipping options are CCLIP=, CLIPCHAR=, CLIPLEGEND=, CLIPLEGPOS=, CLIPSUBCHAR=, and CLIPSYMBOL=.
- CLIPLEGEND='label'
-
specifies the label for the legend that indicates the number of clipped points when the CLIPFACTOR= option is used. The label must be no more than 16 characters and must be enclosed in quotes. For an example, see Figure 17.170.
- CLIPLEGPOS=TOP | BOTTOM
-
specifies the position for the legend that indicates the number of clipped points when the CLIPFACTOR= option is used. The keywords TOP and BOTTOM position the legend at the top or bottom of the chart, respectively. Do not specify CLIPLEGPOS=TOP together with the PHASELEGEND option or the BLOCKPOS=1 or BLOCKPOS=2 options. By default, CLIPLEGPOS=BOTTOM.
- CLIPSUBCHAR='character'
-
specifies a substitution character (such as #) for the label provided with the CLIPLEGEND= option. The substitution character is replaced with the number of points that are clipped. For example, suppose that the following statements produce a chart in which three extreme points are clipped:
proc shewhart data=Pistons;
   xrchart Diameter*Hour /
      clipfactor  = 1.5
      cliplegend  = 'Points clipped=#'
      clipsubchar = '#' ;
run;
Then the clipping legend displayed on the chart will be
Points clipped=3
- CLIPSYMBOL=symbol
-
Traditional Graphicsspecifies a plot symbol used to identify clipped points on the chart and in the legend when the CLIPFACTOR= option is used. You should use this option in conjunction with the CLIPFACTOR= option. The default symbol is CLIPSYMBOL=SQUARE.
- CLIPSYMBOLHT=value
-
Traditional Graphicsspecifies the height for the symbol marker used to identify clipped points on the chart when the CLIPFACTOR= option is used. The default is the height specified with the H= option in the SYMBOL statement.
For general information about clipping options, refer to Clipping Extreme Points.
- CNEEDLES=color
-
Traditional Graphicsrequests that points are to be connected to the central line with vertical line segments (needles) and specifies the color of the needles. You can use needles to visually represent the process as a series of shocks or vertical displacements away from a constant mean. See Figure 17.167 for an example. The CNEEDLES= option is available in all chart statements except the BOXCHART statement.
-
CONNECTCHAR='character'
CCHAR='character' -
Line Printerspecifies the character used to form line segments that connect points on a chart. The default character is a plus (+) sign.
- CONTROLSTAT=MEAN | MEDIAN
-
specifies whether the control limits displayed in a box chart are to be computed for subgroup means or for subgroup medians. By default, CONTROLSTAT=MEAN. The CONTROLSTAT= option is available only in the BOXCHART statement.
-
COUT=color
COUT -
Traditional GraphicsODS Graphicsspecifies the color for the plotting symbols and the portions of connecting line segments that lie outside the control limits. Specify COUT with no argument to use an appropriate contrasting color from the ODS style. This option is useful for highlighting out-of-control subgroups.
When ODS Graphics is enabled and the BOXCHART statement or STARVERTICES= option is used, COUT highlights the boxes or stars whose subgroup values fall outside the control limits.
- COUTFILL=color
-
Traditional Graphicsspecifies the fill color for the areas outside the control limits that lie between the connected points and the control limits and are bounded by connecting lines. This option is useful for highlighting out-of-control points. See Figure 17.201 for an example. By default, these areas are not filled. You can use the OUTFILL option to fill this area with an appropriate color from the ODS style. Note that you can use the CINFILL= option to fill the area inside the control limits.
- COVERLAY=(color-list)
-
Traditional Graphicsspecifies the colors used to plot primary chart overlay variables. Colors in the COVERLAY= list are matched with variables in the corresponding positions in the OVERLAY= list.
- COVERLAY2=(color-list)
-
Traditional Graphicsspecifies the colors used to plot secondary chart overlay variables. Colors in the COVERLAY2= list are matched with variables in the corresponding positions in the OVERLAY2= list.
- COVERLAYCLIP=color
-
Traditional Graphicsspecifies the color used to plot clipped values on overlay plots when the CLIPFACTOR= option is used.
-
CPHASEBOX=color
CPHASEBOX
PHASEBOX -
Traditional GraphicsODS Graphicsspecifies the color for a box that encloses all of the plotted points for a phase (group of consecutive observations that have the same value of the variable
_PHASE_). Specify CPHASEBOX or PHASEBOX with no argument to request phase boxes drawn using an appropriate color from the ODS style. By default, an enclosing box is not drawn. This option is available only in the BOXCHART statement. -
CPHASEBOXCONNECT=color
CPHASEBOXCONNECT
PHASEBOXCONNECT -
Traditional GraphicsODS Graphicsspecifies the color for line segments that connect the vertical edges of adjacent enclosing boxes requested with the CPHASEBOX= option or the CPHASEBOXFILL= option. The vertical coordinates of the attachment points represent the average of the values plotted inside the box. The CPHASEBOXCONNECT= option is an alternative to the CPHASEMEANCONNECT= option. Specify CPHASEBOXCONNECT or PHASEBOXCONNECT with no argument to connect the phase boxes with lines drawn in an appropriate color from the ODS style. This option is available only in the BOXCHART statement.
-
CPHASEBOXFILL=color
CPHASEBOXFILL
PHASEBOXFILL -
Traditional GraphicsODS Graphicsspecifies the fill color for a box that encloses all of the plotted points for a phase. Specify CPHASEBOXFILL or PHASEBOXFILL with no argument to fill the phase boxes with an appropriate color from the ODS style. By default, an enclosing box is not drawn. This option is available only in the BOXCHART statement.
- CPHASELEG=color
-
Traditional Graphicsspecifies a text color for the phase labels requested with the PHASELEGEND option. By default, if you specify a list of fill colors with the CFRAME= option, these colors are used for the corresponding phase labels, otherwise, the CTEXT= color is used for the phase labels.
-
CPHASEMEANCONNECT=color
CPHASEMEANCONNECT
PHASEMEANCONNECT -
Traditional GraphicsODS Graphicsspecifies the color for line segments that connect points representing the average of the values plotted within a phase. This option must be used in conjunction with the CPHASEBOX= or CPHASEBOXFILL= options, and it is an alternative to the CPHASEBOXCONNECT= option. The points are centered horizontally within the enclosing boxes. Specify CPHASEMEANCONNECT or PHASEMEANCONNECT with no argument to connect phase means with lines drawn in an appropriate color from the ODS style. This option is available only in the BOXCHART statement.
- CSTARCIRCLES=color
-
Traditional Graphicsspecifies a color for the circles requested with the STARCIRCLES= option. See Displaying Auxiliary Data with Stars. By default, the color specified with the CSTARS= option is used.
-
CSTARFILL=color
CSTARFILL=(variable) -
Traditional Graphicsspecifies a color or colors for filling the interior of stars requested with the STARVERTICES= option. You can use one of the following approaches:
-
Specify a single color to be used for all stars with CSTARFILL=color.
-
Specify a distinct color for each star (or subsets of stars) by providing the colors as values of a variable specified with CSTARFILL=(variable). The variable must be a character variable of length 8 or less in the input data set, and its values must be valid SAS/GRAPH colors or the value EMPTY. The color for the star positioned at the ith subgroup on the chart is the value of the CSTARFILL= variable in the observations corresponding to the ith subgroup. Note that if there are multiple observations per subgroup in the input data set (for instance, if you are using the XRCHART statement in the SHEWHART procedure to analyze observations from a DATA= input data set), the values of the CSTARFILL= variable should be identical for all the observations in a given subgroup.
See Displaying Auxiliary Data with Stars.
You can use the STARFILL= option to group stars to be filled with different colors from the ODS style. By default, all stars are filled with a single color from the ODS style.
-
-
CSTAROUT=color
CSTAROUT -
Traditional GraphicsODS Graphicsspecifies a color for those portions of the outlines of stars (requested with the STARVERTICES= option) that exceed the inner or outer circles. This option applies only with the STARTYPE=RADIAL and STARTYPE=SPOKE options, and it is useful for highlighting extreme values of star vertex variables. Specify CSTAROUT with no argument to use an appropriate contrasting color from the ODS style. See Displaying Auxiliary Data with Stars.
-
CSTARS=color
CSTARS=(variable) -
Traditional Graphicsspecifies a color or colors for the outlines of stars requested with the STARVERTICES= option.
You can use one of the following approaches:
-
You can specify a single color to be used for all the stars on the chart with CSTARS=color.
-
You can specify a distinct outline color for each star (or subsets of stars) by providing the colors as values of a variable specified with CSTARS=(variable). The variable must be a character variable of length 8 or less in the input data set. The outline color for the star positioned at the ith subgroup on the chart is the value of the CSTARS=variable in the observations corresponding to the ith subgroup. Note that if there are multiple observations per subgroup in the input data set (for instance, if you are using the XRCHART statement in the SHEWHART procedure to analyze observations from a DATA= input data set), the values of the CSTARS= variable should be identical for all the observations in a given subgroup.
See Displaying Auxiliary Data with Stars.
You can use the STARS= option to group stars to be drawn with different colors from the ODS style. By default, all stars are drawn with a single color from the ODS style.
-
-
CSYMBOL='label'
CSYMBOL=C | CBAR | CPM | CPM2 | C0 -
specifies a label for the central line in a c chart. You can use the option in two ways:
-
You can specify a quoted label of length 16 or less.
-
You can specify one of the keywords listed in the following table. Each keyword requests a label of the form symbol=value, where symbol is the symbol given in the table, and value is the value of the central line. If the central line is not constant, only the symbol is displayed.
Symbol Used in
Keyword
Graphics
Line Printer Charts
C
C
C
CBAR

CPM

CPM2

C0

C0
See Example 17.9 for an example. The default keyword is CBAR. The CSYMBOL= option is available only in the CCHART statement.
-
- CTESTLABBOX=color
-
Traditional Graphicsspecifies the color for boxes enclosing labels for positive tests for special causes requested with the TESTLABBOX option. If you use the CTESTLABBOX= option, you do not need to specify the TESTLABBOX option.
-
CTESTS=color | test-color-list
CTEST=color | test-color-list -
Traditional Graphicsspecifies colors for labels indicating points where a test is positive.
-
You can specify the color for the labels used to identify points at which tests for special causes specified in the TESTS= option are positive. For Tests 2 through 8, this color is also used for the line segments that connect patterns of points for which a test is positive.
-
You can specify the test-color-list to enable different colors to be used for the labels and highlighted line segments associated with different tests for special causes. Any positive tests for which no specific CTESTS= value is specified are displayed using the general CTESTS= color. A non-default general CTESTS= color can be specified using the CTESTS=color syntax.
The following options request the standard tests for special causes 1 through 4 and one user-defined test designated B.
TESTS  = 1 to 4 M(K=4 DIR=DEC Code=B);
CTESTS = green;
CTESTS = (1 purple 3 yellow B blue);
Test 1 will be displayed in purple, Test 3 in yellow, and Test B in blue. Tests 2 and 4 will be displayed in green, the general CTESTS= color.
-
-
CTESTSYMBOL=color
CTESTSYM=color -
Traditional Graphicsspecifies the color of the symbol used to plot subgroups with positive tests for special causes.
- CTEXT=color
-
Traditional Graphicsspecifies the color for tick mark values and axis labels. This color is also used for the sample size legend and for the control limit legend. The default color is the color specified in the CTEXT= option in the most recent GOPTIONS statement.
-
CVREF=color
CV=color -
Traditional Graphicsspecifies the color for reference lines requested by the VREF= and VREF2= options.
- CZONES=color
-
Traditional Graphicsrequests lines marking zones A, B, and C for the tests for special causes (see the TESTS= option) and specifies the color for these lines. This color is also used for labels requested with the ZONELABELS option.
- DATAUNIT=PERCENT | PROPORTION
-
enables you to use percents or proportions as the values for processes when you are using the PCHART or NPCHART statements and reading a DATA= input data set. Specify DATAUNIT=PERCENT to indicate that the values are percents of nonconforming items. Specify DATAUNIT=PROPORTION to indicate that the values are proportions of nonconforming items. Values for percents can range from 0 to 100, while values for proportions can range from 0 to 1. By default, the values of processes read from a DATA= data set for PCHART and NPCHART statements are assumed to be numbers (counts) of nonconforming items. The DATAUNIT= option is available only in the NPCHART and PCHART statements.
-
DESCRIPTION='string'
DES='string' -
Traditional Graphicsspecifies a description, up to 256 characters long, for the GRSEG catalog entry for the primary chart. The default string is the variable name. A related option is NAME=.
-
DESCRIPTION2='string'
DES2='string' -
Traditional Graphicsspecifies a description, up to 256 characters long, for the GRSEG catalog entry for the secondary chart. The default string is the variable name. The DESCRIPTION2= option is available in the IRCHART, MRCHART, XRCHART, and XSCHART statements, and it is used in conjunction with the SEPARATE option. A related option is NAME2=.
- DISCRETE
-
specifies that numeric subgroup variable values be treated as discrete values, so that each tick value on the default subgroup axis corresponds to a unique subgroup variable value. By default, a continuous subgroup axis is created, and if the subgroup variable values are not evenly spaced, the axis contains ticks with no corresponding subgroup data.
- ENDGRID
-
Traditional GraphicsLine Printeradds a grid to the rightmost portion of the chart, beginning with the first labeled major tick mark position that follows the last plotted point. This grid is useful in situations where you want to add points by hand after the chart is created. You can use the HAXIS= option to force space to be added to the horizontal axis.
- EXCHART
-
creates a control chart only when exceptions occur, specifically, when the control limits are exceeded or when any of the tests requested with the TESTS= option or the TESTS2= option are positive.
- FONT=font
-
Traditional Graphicsspecifies a software font for labels and legends. You can also specify fonts for axis labels in an AXIS statement. The FONT= font takes precedence over the FTEXT= font specified in the GOPTIONS statement. Hardware characters are used by default.
- FRONTREF
-
Traditional GraphicsODS Graphicsdraws reference lines specified with the HREF= and VREF= options in front of box-and-whiskers plots. By default, reference lines are drawn behind the box-and-whiskers plots and can be obscured by filled boxes.
- GRID
-
adds a grid to the control chart. Grid lines are horizontal and vertical lines positioned at labeled major tick marks, and they cover the length and height of the plotting area.
-
HAXIS=values
HAXIS=AXISn -
specifies tick mark values for the horizontal (subgroup) axis. If the subgroup variable is numeric, the values must be numeric and equally spaced. Numeric values can be given in an explicit or implicit list. If the subgroup variable is character, values must be quoted strings of length 32 or less. If a date, time, or datetime format is associated with a numeric subgroup variable, SAS datetime literals can be used. Examples of HAXIS= lists follow:
haxis=0 2 4 6 8 10
haxis=0 to 10 by 2
haxis='LT12A' 'LT12B' 'LT12C' 'LT15A' 'LT15B' 'LT15C'
haxis='20MAY88'D to '20AUG88'D by 7
haxis='01JAN88'D to '31DEC88'D by 30
If the subgroup variable is numeric, the HAXIS= list must span the subgroup variable values, and if the subgroup variable is character, the HAXIS= list must include all of the subgroup variable values. You can add subgroup positions to the chart by specifying HAXIS= values that are not subgroup variable values.
If you specify a large number of HAXIS= values, some of these may be thinned to avoid collisions between tick mark labels. To avoid thinning, use one of the following methods:
-
Shorten values of the subgroup variable by eliminating redundant characters. For example, if your subgroup variable has values LOT1, LOT2, LOT3, and so on, you can use the SUBSTR function in a DATA step to eliminate “LOT” from each value, and you can modify the horizontal axis label to indicate that the values refer to lots.
-
Use the TURNHLABELS option to turn the labels vertically.
-
Use the NPANELPOS= option to force fewer subgroup positions per panel.
If you are producing traditional graphics, you can also specify a previously defined AXIS statement with the HAXIS= option.
-
- HEIGHT=value
-
Traditional Graphicsspecifies the height (in vertical screen percent units) of the text for axis labels and legends. This value takes precedence over the HTEXT= value specified in the GOPTIONS statement. This option is recommended for use with software fonts specified with the FONT= option or with the FTEXT= option in the GOPTIONS statement. Related options are LABELHEIGHT= and TESTHEIGHT=.
-
HMINOR=n
HM=n -
Traditional Graphicsspecifies the number of minor tick marks between each major tick mark on the horizontal axis. Minor tick marks are not labeled. The default is 0.
- HOFFSET=value
-
Traditional GraphicsODS Graphicsspecifies the length the offset at both ends of the horizontal axis. For traditional graphics, the offset is specified in percent screen units. For ODS Graphics output, the offset is specified in pixels. You can eliminate the offset by specifying HOFFSET=0.
-
HREF=values
HREF=SAS-data-set -
draws reference lines perpendicular to the horizontal (subgroup) axis on the primary chart. You can use this option in the following ways:
-
You can specify the values for the lines with an HREF= list. If the subgroup variable is numeric, the values must be numeric. If the subgroup variable is character, the values must be quoted strings of up to 32 characters. If the subgroup variable is formatted, the values must be given as internal values.
Examples of HREF=values follow:
href=5
href=5 10 15 20 25 30
href='Shift 1' 'Shift 2' 'Shift 3'
-
You can specify the values for the lines as the values of a variable named
_REF_in an HREF= data set. The type and length of_REF_must match those of the subgroup variable specified in the chart statement. Optionally, you can provide labels for the lines as values of a variable named_REFLAB_, which must be a character variable of length 16 or less. If you want distinct reference lines to be displayed in charts for different processes specified in the chart statement, you must include a character variable of length 32 or less named_VAR_, whose values are the processes. If you do not include the variable_VAR_, all of the lines are displayed in all of the charts.Each observation in the HREF= data set corresponds to a reference line. If BY variables are used in the input data set (DATA=, HISTORY=, or TABLE=), the same BY variable structure must be used in the HREF= data set unless you specify the NOBYREF option.
Related options are CHREF=, HREFCHAR=, HREFLABELS=, HREFLABPOS=, LHREF=, and NOBYREF.
-
-
HREF2=values
HREF2=SAS-data-set -
draws reference lines perpendicular to the horizontal (subgroup) axis on the secondary chart. The conventions for specifying the HREF2= option are identical to those for specifying the HREF= option. Related options are CHREF=, HREFCHAR=, HREF2LABELS=, HREFLABPOS=, LHREF=, and NOBYREF. The HREF2= option is available only in the IRCHART, MRCHART, XRCHART, and XSCHART statements and in the BOXCHART, MCHART, and XCHART statements with the TRENDVAR= option.
- HREF2DATA=SAS-data-set
-
draws reference lines perpendicular to the horizontal (subgroup) axis on the secondary chart. The HREF2DATA= option must be used in place of the HREF2= option to specify a data set using the quoted filename notation.
-
HREF2LABELS='label1' …'labeln'
HREF2LABEL='label1' …'labeln'
HREF2LAB='label1' …'labeln' -
specifies labels for the reference lines requested by the HREF2= option. The number of labels must equal the number of lines. Enclose each label in quotes. Labels can be up to 16 characters. The HREF2LABELS= option is available only in the IRCHART, MRCHART, XRCHART, and XSCHART statements and in the BOXCHART, MCHART, and XCHART statements with the TRENDVAR= option.
- HREFCHAR='character'
-
Line Printerspecifies the character used for reference lines requested by the HREF= and HREF2= options on line printer charts. The default is the vertical bar (|).
- HREFDATA=SAS-data-set
-
draws reference lines perpendicular to the horizontal (subgroup) axis on the primary chart. The HREFDATA= option must be used in place of the HREF= option to specify a data set using the quoted filename notation.
-
HREFLABELS='label1' …'labeln'
HREFLABEL='label1' …'labeln'
HREFLAB='label1' …'labeln' -
specifies labels for the reference lines requested by the HREF= option. The number of labels must equal the number of lines. Enclose each label in quotes. Labels can be up to 16 characters.
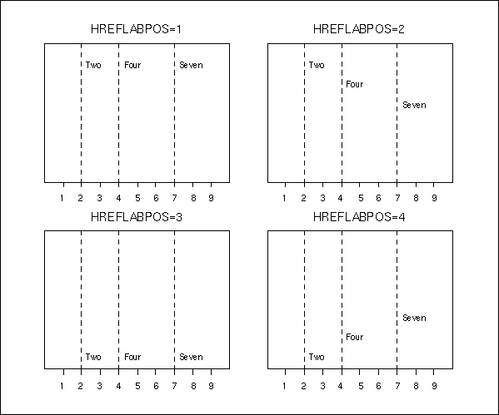
- HREFLABPOS=n
-
specifies the vertical position of the HREFLABEL= and HREF2LABEL= labels, as described in the following table. By default, n = 2.
n
Position
1
along top of subplot area
2
staggered from top to bottom of subplot area
3
along bottom of subplot area
4
staggered from bottom to top of subplot area
Figure 17.133 illustrates label positions for values of the HREFLABPOS= option when the HREF= and HREFLABELS= options are as follows:
href       = 2 4 7
hreflabels = 'Two' 'Four' 'Seven'
Figure 17.133: Positions for Reference Line Labels
- HTML=variable
-
Traditional Graphicsspecifies a variable whose values create links associated with subgroup points on a primary control chart when traditional graphics output is directed into HTML. You can specify a character variable or formatted numeric variable. The value of the HTML= variable should be the same for each observation with a given value of the subgroup variable. See the section Interactive Control Charts: SHEWHART Procedure for more information.
- HTML2=variable
-
Traditional Graphicsspecifies a variable whose values create links associated with subgroup points on a secondary control chart when traditional graphics output is directed into HTML. You can specify a character variable or formatted numeric variable. The value of the HTML2= variable should be the same for each observation with a given value of the subgroup variable. See the section Interactive Control Charts: SHEWHART Procedure for more information.
- HTML_LEGEND=variable
-
Traditional Graphicsspecifies HTML links as values of the specified character variable (or formatted values of a numeric variable). These links are associated with symbols in the legend for the levels of a symbol-variable. The value of the HTML_LEGEND= variable should be the same for each observation with a given value of symbol-variable.
- IDCOLOR=color
-
Traditional Graphicsspecifies the color of the symbol marker used to identify outliers in schematic box-and-whisker plots produced with the BOXCHART statement when you use one of the following options: BOXSTYLE=SCHEMATIC, BOXSTYLE=SCHEMATICID, and BOXSTYLE=SCHEMATICIDFAR. The default color is the color specified with the CBOXES= option. The IDCOLOR option is available only in the BOXCHART statement.
- IDCTEXT=color
-
Traditional Graphicsspecifies the color for the text used to label outliers or indicate process variable values when you specify one of the keywords SCHEMATICID, SCHEMATICIDFAR, POINTSID, or POINTSJOINID with the BOXSTYLE= option. The default is the color specified with the CTEXT= option.
- IDFONT=font
-
Traditional Graphicsspecifies the font for the text used to label outliers or indicate process variable values when you specify one of the keywords SCHEMATICID, SCHEMATICIDFAR, POINTSID, or POINTSJOINID with the BOXSTYLE= option. The default font is SIMPLEX.
- IDHEIGHT=value
-
Traditional Graphicsspecifies the height for the text used to label outliers or indicate process variable values when you specify one of the keywords SCHEMATICID, SCHEMATICIDFAR, POINTSID, or POINTSJOINID with the BOXSTYLE= option. The default is the height specified with the HTEXT= option in the GOPTIONS statement.
- IDSYMBOL=symbol
-
Traditional Graphicsspecifies the symbol marker used to identify outliers in schematic box-and-whisker plots produced with the BOXCHART statement when you use one of the following options: BOXSTYLE=SCHEMATIC, BOXSTYLE=SCHEMATICID, and BOXSTYLE=SCHEMATICIDFAR. The default symbol is SQUARE. The IDSYMBOL= option is available only in the BOXCHART statement.
-
INDEPENDENTZONES
INDEPZONES -
specifies that the widths of the zones requested with the ZONES option be computed independently above and below the center line of the chart, so that the width of each zone is one-third of the difference between the process mean and the control limit on its side of the chart. By default, the width of all zones is one-third of the difference between the upper control limits and the process mean, with zones below the center line truncated if necessary. The INDEPENDENTZONES option has no effect when the control limits are symmetric.
- INFILLTRANSPARENCY=value
-
ODS Graphicsspecifies the control limit infill transparency when transparency is used in ODS Graphics output. The value be between 0 and 1, where 0 is completely opaque and 1 is completely transparent. The default control limit infill transparency is 0.75.
- INTERVAL=DAY | DTDAY | HOUR | MINUTE | MONTH | QTR | SECOND
-
specifies the natural time interval between consecutive subgroup positions when a time, date, or datetime format is associated with a numeric subgroup variable. By default, the INTERVAL= option uses the number of subgroup positions per panel that you specify with the NPANELPOS= option. The default time interval keywords for various time formats are shown in the following table.
Format
Default Keyword
Format
Default Keyword
DATE
DAY
MONYY
MONTH
DATETIME
DTDAY
TIME
SECOND
DDMMYY
DAY
TOD
SECOND
HHMM
HOUR
WEEKDATE
DAY
HOUR
HOUR
WORDDATE
DAY
MMDDYY
DAY
YYMMDD
DAY
MMSS
MINUTE
YYQ
QTR
You can use the INTERVAL= option to modify the effect of the NPANELPOS= option, which specifies the number of subgroup positions per panel (screen or page). The INTERVAL= option enables you to match the scale of the horizontal axis to the scale of the subgroup variable without having to associate a different format with the subgroup variable.
For example, suppose your formatted subgroup values span an overall time interval of 100 days and a DATETIME format is associated with the subgroup variable. Since the default interval for the DATETIME format is DTDAY and since NPANELPOS=50 by default, the chart is displayed with two panels (screens or pages).
Now, suppose your data span an overall time interval of 100 hours and a DATETIME format is associated with the subgroup variable. The chart for these data are created in a single panel, but the data occupy only a small fraction of the chart since the scale of the data (hours) does not match that of the horizontal axis (days). If you specify INTERVAL=HOUR, the horizontal axis is scaled for 50 hours, matching the scale of the data, and the chart is displayed with two panels.
- INTSTART=value
-
specifies the starting value for a numeric horizontal axis, when a date, time, or datetime format is associated with the subgroup variable. If the value specified is greater than the first subgroup variable value, this option has no effect.
- LABELANGLE=angle
-
Traditional GraphicsODS Graphicsspecifies the angle at which labels requested with the ALLLABEL=, ALLLABEL2=, OUTLABEL=, and OUTLABEL2= options are drawn. A positive angle rotates the labels counterclockwise; a negative angle rotates them clockwise. By default, labels are oriented horizontally.
-
LABELFONT=font
TESTFONT=font -
Traditional Graphicsspecifies a software font for labels requested with the ALLLABEL=, ALLLABEL2=, OUTLABEL=, OUTLABEL2=, STARLABEL=, TESTLABEL=, and TESTLABELn= options. Hardware characters are used by default.
-
LABELHEIGHT=value
TESTHEIGHT=value -
Traditional Graphicsspecifies the height (in vertical percent screen units) for labels requested with the ALLLABEL=, ALLLABEL2=, OUTLABEL=, OUTLABEL2=, STARLABEL=, TESTLABEL=, and TESTLABELn= options. The default height is the height specified with the HEIGHT= option or the HTEXT= option in the GOPTIONS statement.
-
LBOXES=linetype
LBOXES=(variable) -
Traditional Graphicsspecifies the line types for the outlines of the box-and-whisker plots created with the BOXCHART statement. You can use one of the following approaches:
-
You can specify LBOXES=linetype to provide a single linetype for all of the box-and-whisker plots.
-
You can specify LBOXES=(variable) to provide a distinct line type for each box-and-whisker plot. The variable must be a numeric variable in the input data set, and its values must be valid SAS/GRAPH linetype values (numbers ranging from 1 to 46). The line type for the plot displayed for a particular subgroup is the value of the variable in the observations corresponding to this subgroup. Note that if there are multiple observations per subgroup in the input data set, the values of the variable should be identical for all of the observations in a given subgroup.
The default value is 1, which produces solid lines. The LBOXES= option is available only in the BOXCHART statement.
-
- LCLLABEL='label'
-
specifies a label for the lower control limit in the primary chart. The label can be of length 16 or less. Enclose the label in quotes. The default label is of the form LCL=value if the control limit has a fixed value; otherwise, the default label is LCL. Related options are LCLLABEL2=, UCLLABEL=, and UCLLABEL2=.
- LCLLABEL2='label'
-
specifies a label for the lower control limit in the secondary chart. The label can be of length 16 or less. Enclose the label in quotes. The default label is of the form LCL=value if the control limit has a fixed value; otherwise, the default label is LCL. The LCLLABEL2= option is available in the IRCHART, MRCHART, XRCHART, and XSCHART statements. Related options are LCLLABEL=, UCLLABEL=, and UCLLABEL2=.
- LENDGRID=n
-
Traditional Graphicsspecifies the line type for the grid requested with the ENDGRID option. The default is n = 1, which produces a solid line. If you use the LENDGRID= option, you do not need to specify the ENDGRID option.
- LGRID=n
-
Traditional Graphicsspecifies the line type for the grid requested with the GRID option. The default is n = 1, which produces a solid line. If you use the LGRID= option, you do not need to specify the GRID option.
-
LHREF=linetype
LH=linetype -
Traditional Graphicsspecifies the line type for reference lines requested with the HREF= and HREF2= options. The default is 2, which produces a dashed line.
-
LIMITN=n
LIMITN=VARYING -
specifies either a fixed or varying nominal sample size for the control limits.
If you specify LIMITN=n, the control limits are computed for the fixed value n, and they do not vary with the subgroup sample sizes. Moreover, subgroup summary statistics are plotted only for those subgroups with a sample size equal to n. You can specify ALLN in conjunction with LIMITN=n to force all of the statistics to be plotted, regardless of subgroup sample size.
If you do not specify LIMITN=n and the subgroup sample sizes are constant, the default value of n is the constant subgroup sample size.
Depending on the chart statement, there are restrictions on the value of n that you can specify with the LIMITN= option. For the MRCHART, RCHART, and XRCHART statements,
 . For the SCHART and XSCHART statements,
  . For the BOXCHART, MCHART, and XCHART statements,
  . If you omit the STDDEVIATIONS option for the MCHART or XCHART statements (or use the RANGES option with the BOXCHART statement)
n < 26. For the CCHART and UCHART statements, n > 0, and n can assume fractional values (for all other chart statements, n must be a whole number). For the PCHART and NPCHART statements, .
. If you omit the STDDEVIATIONS option for the MCHART or XCHART statements (or use the RANGES option with the BOXCHART statement)
n < 26. For the CCHART and UCHART statements, n > 0, and n can assume fractional values (for all other chart statements, n must be a whole number). For the PCHART and NPCHART statements, .
For the IRCHART statement, n has a somewhat different interpretation; it specifies the number of consecutive measurements from which the moving ranges are to be computed, and
. You can think of n as a pseudo nominal sample size for the control limits, since the data for an individual measurements and moving range chart are not
subgrouped.
Note the difference between the LIMITN= option and the SUBGROUPN= option that is available in the CCHART, NPCHART, PCHART, and UCHART statements. The LIMITN= option specifies a nominal sample size for the control limits, whereas the SUBGROUPN= option provides the sample sizes for the data.
By default, LIMITN=2 in an IRCHART statement. You cannot specify LIMITN= VARYING in an IRCHART statement. For all other chart statements, LIMITN= VARYING is the default.
The following table identifies the chart features that vary when you use LIMITN= VARYING:
Chart
Statement
Features Affected by LIMITN=VARYING
BOXCHART
control limits
CCHART
control limits, central line
MCHART
control limits
MRCHART
control limits on both charts, central line on R chart
NPCHART
control limits, central line
PCHART
control limits
RCHART
control limits, central line
SCHART
control limits, central line
UCHART
control limits
XCHART
control limits
XRCHART
control limits on both charts, central line on R chart
XSCHART
control limits on both charts, central line on s chart
Note: As an alternative to specifying the LIMITN= option, you can read the nominal control limit sample size from the variable
_LIMITN_in a LIMITS= data set. See “Input Data Sets” in the section for the chart statement in which you are interested. - LIMLABSUBCHAR='character'
-
specifies a substitution character (such as #) for labels provided as quoted strings with the LCLLABEL=, LCLLABEL2=, UCLLABEL=, UCLLABEL2=, CSYMBOL=, NPSYMBOL=, PSYMBOL=, RSYMBOL=, SSYMBOL=, USYMBOL=, and XSYMBOL= options. The substitution character must appear in the label. When the label is displayed on the chart, the character is replaced with the value of the corresponding control limit or center line, provided that this value is constant across subgroups. Otherwise, the default label for a varying control limit or center line is displayed.
- LLIMITS=linetype
-
Traditional Graphicsspecifies the line type for control limits. The default is 4, which produces a dashed line.
- LOVERLAY=(linetypes)
-
Traditional Graphicsspecifies line types for the line segments connecting points on primary chart overlays. Line types in the LOVERLAY= list are matched with variables in the corresponding positions in the OVERLAY= list.
- LOVERLAY2=(linetypes)
-
Traditional Graphicsspecifies line types for the line segments connecting points on secondary chart overlays. Line types in the LOVERLAY2= list are matched with variables in the corresponding positions in the OVERLAY2= list.
- LSL=value-list
-
provides lower specification limits used to compute capability indices. If you provide more than one value, the number of values must match the number of processes listed in the chart statement. If you specify only one value, it is used for all the processes.
The SHEWHART procedure uses the specification limits to compute capability indices, and it saves the limits and indices in the OUTLIMITS= data set. For more information, see Capability Indices and “Output Data Sets” in the section for the chart statement in which you are interested. Also see the entry for the USL= option. The LSL= option is available in the BOXCHART, IRCHART, MCHART, MRCHART, RCHART, SCHART, XCHART, XRCHART, and XSCHART statements.
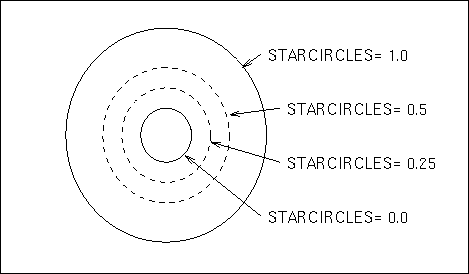
- LSTARCIRCLES=linetypes
-
Traditional Graphicsspecifies one or more line types for the circles requested with the STARCIRCLES= option. The number of line types should match the number of circles requested, and the line types are paired with the circles in the order specified. The default linetype is 1, which produces a solid line.
Figure 17.134 illustrates circles displayed by the following LSTARCIRCLES= and STARCIRCLES= options:
starcircles  = 0.0 1.0 0.25 0.5
lstarcircles = 1 1 2 2
Figure 17.134: Line Types for Reference Circles
-
LSTARS=linetype
LSTARS=(variable) -
Traditional Graphicsspecifies the line types for the outlines of stars requested with the STARVERTICES= option. You can use one of the following approaches:
-
You can specify LSTARS=linetype to provide a single line type for all of the stars.
-
You can specify LSTARS=(variable) to provide a distinct line type for each star. The variable must be a numeric variable in the input data set, and its values must be valid SAS/GRAPH line types. The line type for the star positioned at a particular subgroup is the value of the variable in the observations corresponding to this subgroup. Note that if there are multiple observations per subgroup in the input data set, the variable values should be identical for all of the observations in a given subgroup.
See Displaying Auxiliary Data with Stars. The default linetype is 1, which produces a solid line.
-
-
LTESTS=linetype
LTEST=linetype -
Traditional Graphicsspecifies the line type for the line segments that connect patterns of points for which a test for special causes (requested with the TESTS= option) is positive. The default is 1, which produces a solid line.
-
LTMARGIN=value
LTM=value -
Traditional GraphicsODS Graphicsspecifies the width of the left marginal area for the plot requested with the LTMPLOT= option. For traditional graphics, the width is specified in horizontal percent screen units. For ODS Graphics output, the width is specified in pixels. The LTMARGIN= option is available only in the IRCHART statement.
- LTMPLOT=keyword
-
Traditional GraphicsODS Graphicsrequests a univariate plot of the control chart statistics that is positioned in the left margin of the control chart. The keywords that you can specify and the associated plots are listed in the following table:
Keyword
Marginal Plot
HISTOGRAM
histogram
DIGIDOT
digidot plot
SKELETAL
skeletal box-and-whisker plot
SCHEMATIC
schematic box-and-whisker plot
SCHEMATICID
schematic box-and-whisker plot with outliers labeled
SCHEMATICIDFAR
schematic box-and-whisker plot with far outliers labeled
The LTMPLOT= option is available only in the IRCHART statement; see Example 17.13 for an example. Refer to Hunter (1988) for a description of digidot plots, and see the entry for the BOXSTYLE= option for a description of the various box-and-whisker plots. Related options are LTMARGIN=, RTMARGIN=, and RTMPLOT=.
-
LVREF=linetype
LV=linetype -
Traditional Graphicsspecifies the line type for reference lines requested by the VREF= and VREF2= options. The default is 2, which produces a dashed line.
- LZONES=n
-
Traditional Graphicsspecifies the line type for lines that delineate zones A, B, and C for standard tests requested with the TESTS= and/or TESTS2= options. The default is n = 2, which produces a dashed line.
- MARKERS
-
ODS Graphicsplots subgroup points with markers. By default, subgroup points are plotted with markers only by the BOXCHART statement. On other types of charts, subgroup points are connected by line segments and are not plotted with markers by default.
- MAXPANELS=n
-
specifies the maximum number of pages or screens for a chart. By default, n = 20.
- MEDCENTRAL=AVGMEAN | AVGMED | MEDMED
-
identifies a method for estimating the process mean
 , which is represented by the central line on a median chart. The methods corresponding to each keyword are given in the following
table:
, which is represented by the central line on a median chart. The methods corresponding to each keyword are given in the following
table:
Keyword
Method for Estimating Process Mean
AVGMEAN
average of subgroup means
AVGMED
average of subgroup medians
MEDMED
median of subgroup medians
The default keyword is AVGMED. The MEDCENTRAL= option is available only in the MCHART and MRCHART statements and in the BOXCHART statement with the CONTROLSTAT=MEDIAN option.
- MISSBREAK
-
determines how subgroups are formed when observations are read from a DATA= data set and a character subgroup-variable is provided. When you specify the MISSBREAK option, observations with missing values of the subgroup variable are not processed. Furthermore, the next observation with a nonmissing value of the subgroup-variable is treated as the beginning observation of a new subgroup even if this value is identical to the most recent nonmissing subgroup value. In other words, by specifying the option MISSBREAK and by inserting an observation with a missing subgroup-variable value into a group of consecutive observations with the same subgroup-variable value, you can split the group into two distinct subgroups of observations.
By default, if MISSBREAK is not specified, observations with missing values of the subgroup variable are not processed, and all remaining observations with the same consecutive value of the subgroup-variable are treated as a single subgroup.
-
MRRESTART
MRRESTART=value -
causes the moving range computation on the IRCHART to be restarted when a missing value is encountered. Without the MRRESTART option, a missing value is simply skipped, and the moving range for the next non-missing subgroup is computed using the most recent previous non-missing value. MRRESTART restarts the moving range computation, so only the observations after the missing value are used in subsequent moving range computations. MRRESTART restarts the moving range computation on any missing value; you can also specify MRRESTART=value to restart only on a particular missing value. For example, MRRESTART=R will restart the computation only when the missing value “.R” is encountered.
- MU0=value
-
specifies a known (standard) value
 for the process mean . By default, is estimated from the data. The MU0= option is available in the BOXCHART, IRCHART, MCHART, MRCHART, XCHART, XRCHART, and
XSCHART statements.
for the process mean . By default, is estimated from the data. The MU0= option is available in the BOXCHART, IRCHART, MCHART, MRCHART, XCHART, XRCHART, and
XSCHART statements.
Note: As an alternative to specifying MU0=
, you can read a predetermined value for from the variable _MEAN_in a LIMITS= data set. See “Input Data Sets” in the section for the chart statement in which you are interested. - NAME='string'
-
Traditional Graphicsspecifies the name of the GRSEG catalog entry for the primary chart, and the name of the graphics output file if one is created. The name can be up to 256 characters long, but the GRSEG name is truncated to eight characters. The default name is 'SHEWHART'. A related option is DESCRIPTION=.
- NAME2='string'
-
Traditional Graphicsspecifies the name of the GRSEG catalog entry for the secondary chart, and the name of the graphics output file if one is created. The name can be up to 256 characters long, but the GRSEG name is truncated to eight characters. The default name is 'SHEWHART'. The NAME2= option is available in the IRCHART, MRCHART, XRCHART, and XSCHART statements, and it is used in conjunction with the SEPARATE option. A related option is DESCRIPTION2=.
- NDECIMAL=n
-
specifies the number of decimal digits in the default labels for the control limits and the central line in the primary chart. The default is one more than the maximum number of decimal digits in the vertical axis tick mark labels. For example, if the vertical axis tick mark label with the largest number of digits after the decimal point is 110.05, the default is n = 3.
- NDECIMAL2=n
-
specifies the number of decimal digits in the default labels for the control limits and central line in a secondary chart. The default is one more than the maximum number of decimal digits in the vertical axis tick mark labels. The NDECIMAL2= option is available in the IRCHART, MRCHART, XRCHART, and XSCHART statements.
- NEEDLES
-
connects plotted points to the central line with vertical line segments (needles). See Example 17.19 for an example. By default, adjacent points are connected to one another. The NEEDLES option is available in all chart statements except the BOXCHART statement.
- NMARKERS
-
identifies a plotted subgroup summary statistic with a special symbol marker (character) when the corresponding subgroup sample size is not equal to the nominal control limit sample size n. Specify the nominal control limit sample size n with the LIMITN= option or with the variable
_LIMITN_read from a LIMITS= data set. The following table summarizes the identification:Sample Size
Graphics Symbol
Line Printer Character


L


G
A legend that explains the symbols is displayed at the bottom of the chart. This legend can be suppressed with the NOLEGEND option.
The NMARKERS option is not available in the IRCHART statement. The NMARKERS option applies only when specified in conjunction with the ALLN option and a fixed nominal control limit sample size provided with the LIMITN= option or the variable
_LIMITN_. See Example 17.40 for an illustration. - NO3SIGMACHECK
-
suppresses the check for
limits when tests for special causes are requested. This enables tests for special causes to be applied when the SIGMAS=
option is used to specify control limits other than the default limits. This option should not be used for standard control chart applications, since the standard tests for special causes
assume limits.
-
NOBLOCKREF
NOPHASEREF -
- NOREF
-
ODS Graphicssuppresses block and phase reference lines from ODS Graphics output. By default, block and phase reference lines are drawn when ODS Graphics is in effect.
-
NOBLOCKREFFILL
NOPHASEREFFILL -
- NOREFFILL
-
ODS Graphicssuppresses the block and phase wall fills from ODS Graphics output. By default, block and phase walls are filled when ODS Graphics is in effect.
-
NOBOXFILLLEGEND
NOFILLLEGEND -
- NOSTARFILLLEGEND
-
ODS Graphicssuppresses the legend for the levels of a BOXFILL= or STARFILL= variable in ODS Graphics output.
- NOBYREF
-
specifies that the reference line information in an HREF=, HREF2=, VREF=, or VREF2= data set is to be applied uniformly to charts created for all the BY groups in the input data set (DATA=, HISTORY=, or TABLE=). If you specify the NOBYREF option, you do not need to provide BY variables in the reference line data set. By default, you must provide BY variables.
- NOCHART
-
suppresses the creation of the chart. You typically specify the NOCHART option when you are using the procedure to compute control limits and save them in an output data set. You can also use the NOCHART option when you are tabulating results with the TABLE and related options.
In the IRCHART, MRCHART, XRCHART, and XSCHART statements, the NOCHART option suppresses the creation of both the primary and secondary charts. If you are producing traditional graphics and specify the NOCHART option, the chart is not saved in a graphics catalog. To save the chart in a graphics catalog while suppressing the display of the chart, specify the NODISPLAY option in a GOPTIONS statement.
- NOCHART2
-
suppresses the creation of a secondary chart. You typically use this option in the IRCHART statement to create a chart for individual measurements and suppress the accompanying chart for moving ranges. The NOCHART2 option is available in the IRCHART, MRCHART, XRCHART, and XSCHART statements.
- NOCONNECT
-
suppresses line segments that connect points on the chart. By default, points are connected except in box charts produced with the BOXCHART statement (see the BOXCONNECT option).
- NOCTL
-
suppresses the display of the central line in a primary chart.
- NOCTL2
-
suppresses the display of the central line in a secondary chart. The NOCTL2 option is available in the IRCHART, MRCHART, XRCHART, and XSCHART statements.
- NOFRAME
-
Traditional GraphicsLine Printersuppresses the default frame drawn around the chart.
- NOHLABEL
-
suppresses the label for the horizontal (subgroup) axis. Use the NOHLABEL option when the meaning of the axis is evident from the tick mark labels, such as when a date format is associated with the subgroup variable.
- NOLCL
-
suppresses the display of the lower control limit in a primary chart.
- NOLCL2
-
suppresses the drawing of the lower control limit in a secondary chart. The NOLCL2 option is available in the IRCHART, MRCHART, XRCHART, and XSCHART statements.
- NOLEGEND
-
suppresses the default legend for subgroup sample sizes, which appears by default below the chart. This option also suppresses the legend displayed by the NMARKERS option. Use the NOLEGEND option when the subgroup sample sizes are constant and equal to the control limit sample size, since the control limit sample size is displayed in the upper right corner of the chart.
- NOLIMIT0
-
suppresses the display of a fixed lower control limit if and only if the value of the limit is zero. This option is useful in situations where a lower limit of zero is considered to be uninformative or visually distracting (for instance, on certain p charts or R charts). The NOLIMIT0 option is available with all chart statements except BOXCHART, MCHART, and XCHART. For the IRCHART, MRCHART, XRCHART, and XSCHART statements, the NOLIMIT0 option applies only to the secondary chart.
- NOLIMIT1
-
suppresses the display of a fixed upper control limit on a p chart if and only if the value of the control limit is 1 (or 100%), or on an
 chart if and only if the value of the control limit is n. The NOLIMIT1 option is available only in the NPCHART and PCHART statements.
- NOLIMITLABEL
-
suppresses the default labels for the control limits and central lines.
- NOLIMITS
-
suppresses the display of control limits. This option is particularly useful if you are using the BOXCHART statement to create side by side box-and-whisker plots; in this case, you should also use one of the BOXSTYLE= options.
- NOLIMITSFRAME
-
Traditional GraphicsLine Printersuppresses the default frame for the control limit information that is displayed across the top of the chart when multiple sets of control limits with distinct multiples of
 and nominal control limit sample sizes are read from a LIMITS= data set.
- NOLIMITSLEGEND
-
suppresses the legend for the control limits (for example, 3
Limits For n=5), which appears by default in the upper right corner of the chart.
- NOOVERLAYLEGEND
-
Traditional GraphicsODS Graphicssuppresses the legend for overlay variables which is displayed by default when the OVERLAY= or OVERLAY2= option is specified.
- NOPHASEFRAME
-
Traditional GraphicsLine Printersuppresses the default frame for the legend requested by the PHASELEGEND option.
- NOREADLIMITS
-
specifies that the control limits for each process listed in the chart statement are not to be read from the LIMITS= data set specified in the PROC SHEWHART statement. There are two basic methods of displaying control limits: calculating control limits from the data and reading control limits from a LIMITS= data set. If you want control limits calculated from the data, you can do one of the following:
-
Do not specify a LIMITS= data set.
-
If you specify a LIMITS= data set, also specify the NOREADLIMITS option.
Otherwise, if you specify a LIMITS= data set in the PROC SHEWHART statement, the procedure reads control limits from that data set.[89]
The following example illustrates the NOREADLIMITS option:
proc shewhart data=Pistons limits=Diamlim;
   xrchart Diameter*Hour;
   xrchart Diameter*Hour / noreadlimits;
run;
The first XRCHART statement reads the control limits from the first observation in the data set DIAMLIM for which the variable
_VAR_is equal to 'Diameter' and the variable_SUBGRP_is equal to 'Hour'. The second XRCHART statement computes the control limits from the measurements in the data setPistons. Note that the second XRCHART statement is equivalent to the following statements, which are more commonly used:proc shewhart data=Pistons; xrchart Diameter*Hour; run;
For more information about reading control limits from a LIMITS= data set, see the entry for the READLIMITS option and Displaying Multiple Sets of Control Limits.
-
- NOTCHES
-
Traditional GraphicsODS Graphicsspecifies that box-and-whisker plots created by the BOXCHART statement are to be notched. The endpoints of the notches are located at the median plus and minus
 , where IQR is the interquartile range and n is the subgroup sample size. The medians (central lines) of two box-and-whisker plots are significantly different at approximately
the 0.05 level if the corresponding notches do not overlap. Refer to McGill, Tukey, and Larsen (1978). Figure 17.135 illustrates the NOTCHES option. Notice the folding effect at the bottom, which happens when the endpoint of a notch is beyond
its corresponding quartile. This situation occurs typically only when the subgroup sample size is small.
, where IQR is the interquartile range and n is the subgroup sample size. The medians (central lines) of two box-and-whisker plots are significantly different at approximately
the 0.05 level if the corresponding notches do not overlap. Refer to McGill, Tukey, and Larsen (1978). Figure 17.135 illustrates the NOTCHES option. Notice the folding effect at the bottom, which happens when the endpoint of a notch is beyond
its corresponding quartile. This situation occurs typically only when the subgroup sample size is small.
Figure 17.135: NOTCHES Option for Box-and-Whisker Plots
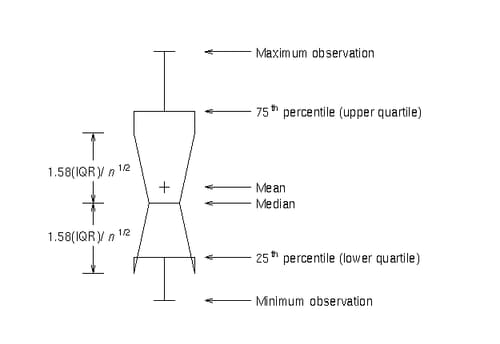
The NOTCHES option is also illustrated in Output 17.3.1 and is available only in the BOXCHART statement.
- NOTESTACROSS
-
specifies that tests for special causes requested with the TESTS= or TESTS2= options not be applied across the boundaries of phases (blocks of consecutive subgroups) determined by the READPHASES= option and the variable
_PHASE_in the input data set. With constant control limits, if you specify the READPHASES= option but do not specify the NOTESTACROSS option, tests for special causes are applied without regard to phase boundaries. With varying control limits, tests are applied only within phases by default, and you can use the TESTACROSS option to specify that they be applied across phase boundaries. See Tests for Special Causes: SHEWHART Procedure. - NOTICKREP
-
applies to character-valued subgroup-variables and specifies that only the first occurrence of repeated, adjacent subgroup values is to be labeled on the horizontal axis.
- NOTRANSPARENCY
-
ODS Graphicsdisables transparency in ODS Graphics output, so that all graph features are opaque. By default, transparency is enabled when ODS Graphics is in effect.
- NOTRENDCONNECT
-
suppresses line segments that connect points on a trend chart. Points are connected by default. The NOTRENDCONNECT option is available only in the BOXCHART, MCHART, and XCHART statements when the TRENDVAR= option is used.
- NOTRUNC
-
overrides the vertical axis truncation at zero, which is applied by default to c charts, moving range charts,
charts, p charts, R charts, s charts, and u charts. This option is useful if you are creating a customized version of one of these charts and want to replace the plotted
statistics and control limits with values read from a TABLE= input data set that can be positive or negative. Do not use the
NOTRUNC option in standard control chart applications. This option is not available in the BOXCHART, MCHART, and XCHART statements.
- NOUCL
-
suppresses the display of the upper control limit in a primary chart.
- NOUCL2
-
suppresses the display of the upper control limit in a secondary chart. The NOUCL2 option is available in the IRCHART, MRCHART, XRCHART, and XSCHART statements.
- NOVANGLE
-
Traditional Graphicsrequests vertical axis labels that are strung out vertically. By default, the labels are drawn at an angle of 90 degrees if a software font is used.
-
NPANELPOS=n
NPANEL=n -
specifies the number of subgroup positions per panel on each chart. A panel is defined as a screen or page (or a half-screen or half-page if you are also using the BILEVEL option). You typically specify the NPANELPOS= option to display more points on a panel than the default number, which is n = 50 for all chart statements except the BOXCHART statement, for which the default is n = 20.
You can specify a positive or negative number for n. The absolute value of n must be at least 5. If n is positive, the number of positions is adjusted so that it is approximately equal to n and so that all panels display approximately the same number of subgroup positions. If n is negative, no balancing is done, and each panel (except possibly the last) displays approximately
 positions. In this case, the approximation is due only to axis scaling.
You can use the INTERVAL= option to change the effect of the NPANELPOS= option when a date or time format is associated with the subgroup-variable. The INTERVAL= option enables you to match the scale of the horizontal axis to the scale of the subgroup variable without having to associate a different format with the subgroup variable.
-
NPSYMBOL='label'
NPSYMBOL=NP | NPBAR | NPPM | NPPM2 | NP0 -
specifies a label for the central line in an
chart. You can use the option in the following ways:
-
You can specify a quoted label up to 16 characters in length.
-
You can specify one of the keywords listed in the following table. Each keyword requests a label of the form symbol=value, where symbol is one of the symbols given in the table, and value is the value of the central line. If the central line is not constant, only the symbol is displayed.
Symbol Used in
Keyword
Graphics
Line Printer Charts
NP
NP
NP
NPBAR

NPPM

NPPM2

NP0

NP0
The default keyword is NPBAR. The NPSYMBOL= option is available only in the NPCHART statement.
-
- ODSFOOTNOTE=FOOTNOTE | FOOTNOTE1 | 'string'
-
ODS Graphicsadds a footnote to ODS Graphics output. If you specify the FOOTNOTE (or FOOTNOTE1) keyword, the value of SAS FOOTNOTE statement is used the as the graph footnote. If you specify a quoted string, that is used as the footnote. The quoted string can contain any of the following escaped characters, which are replaced with the appropriate values from the analysis:
 n
n-
process variable name
- l
-
process variable label (or name if the process variable has no label)
- x
-
subgroup variable name
- s
-
subgroup variable label (or name if the subgroup variable has no label)
- ODSFOOTNOTE2=FOOTNOTE2 | 'string'
-
ODS Graphicsadds a secondary footnote to ODS Graphics output. If you specify the FOOTNOTE2 keyword, the value of SAS FOOTNOTE2 statement is used as the secondary graph footnote. If you specify a quoted string, that is used as the secondary footnote. The quoted string can contain any of the following escaped characters, which are replaced with the appropriate values from the analysis:
- n
-
process variable name
- l
-
process variable label (or name if the process variable has no label)
- x
-
subgroup variable name
- s
-
subgroup variable label (or name if the subgroup variable has no label)
- ODSLEGENDEXPAND
-
ODS Graphicsspecifies that legend entries contain all levels observed in the data. By default, a legend shows only the levels used on the current page.
- ODSTITLE=TITLE | TITLE1 | NONE | DEFAULT | LABELFMT | 'string'
-
ODS Graphicsspecifies a title for ODS Graphics output.
- TITLE (or TITLE1)
-
uses the value of SAS TITLE statement as the graph title.
- NONE
-
suppresses all titles from the graph.
- DEFAULT
-
uses the default ODS Graphics title (a descriptive title consisting of the plot type and the process variable name.)
- LABELFMT
-
uses the default ODS Graphics title with the variable label instead of the variable name.
If you specify a quoted string, that is used as the graph title. The quoted string can contain any of the following escaped characters, which are replaced with the appropriate values from the analysis:
- n
-
process variable name
- l
-
process variable label (or name if the process variable has no label)
- x
-
subgroup variable name
- s
-
subgroup variable label (or name if the subgroup variable has no label)
- ODSTITLE2=TITLE2 | 'string'
-
ODS Graphicsspecifies a secondary title for ODS Graphics output. If you specify the TITLE2 keyword, the value of SAS TITLE2 statement is used as the secondary graph title. If you specify a quoted string, that is used as the secondary title. The quoted string can contain any of the following escaped characters, which are replaced with the appropriate values from the analysis:
- n
-
process variable name
- l
-
process variable label (or name if the process variable has no label)
- x
-
subgroup variable name
- s
-
subgroup variable label (or name if the subgroup variable has no label)
- OUTBOX=SAS-data-set
-
creates an output data set that contains subgroup summary statistics, control limits, and outlier values for a box chart. An OUTBOX= data set is the only type of summary data set produced by the SHEWHART procedure from which you can reconstruct a schematic box chart. The OUTBOX= option is available only in the BOXCHART statement. See OUTBOX= Data Set for details.
-
OUTFILL
COUTFILL -
Traditional GraphicsODS Graphicsfills the areas outside the control limits that lie between the connected points and the control limits and are bounded by connecting lines. The areas are filled with an appropriate contrasting color from the ODS style. This option is useful for highlighting out-of-control points.
- OUTFILLTRANSPARENCY=value
-
ODS Graphicsspecifies the control limit outfill transparency when transparency is used in ODS Graphics output. The value must be between 0 and 1, where 0 is completely opaque and 1 is completely transparent. The default control limit outfill transparency is 0.75.
- OUTHIGHHTML=variable
-
Traditional Graphicsspecifies a variable whose values create links to be associated with outlier points above the upper fence on a schematic box chart when traditional graphics output is directed into HTML.
- OUTHIGHURL=variable
-
ODS Graphicsspecifies a variable whose values are URLs to be associated with outlier points above the upper fence on a schematic box chart when ODS Graphics output is directed into HTML.
- OUTHISTORY=SAS-data-set
-
creates an output data set that contains the subgroup summary statistics. You can use an OUTHISTORY= data set as a HISTORY= input data set in a subsequent run of the procedure. You cannot request an OUTHISTORY= data set if the input data set is a TABLE= data set. See “Output Data Sets” in the section for the chart statement in which you are interested. A related option is OUTPHASE=.
- OUTINDEX='label'
-
specifies the value of the
_INDEX_variable in the OUTLIMITS= output data set. This is a bookkeeping variable that provides information identifying the control limits saved in the data set. See “Output Data Sets” in the section for the chart statement in which you are interested.The label can be up to 128 characters and should be enclosed in quotes. You should use a label that uniquely identifies the control limits. For example, you might specify OUTINDEX='April 1-15' to indicate that the limits were computed from data collected during the first half of April.
The OUTINDEX= option is intended to be used in conjunction with the OUTLIMITS= option. The
_INDEX_variable is created only if you specify the OUTINDEX= option. If you specify the OUTINDEX= option and do not specify the name of the OUTLIMITS= data set with the OUTLIMITS= option, the procedure creates an OUTLIMITS= data set whose name is of the form WORK.DATAn.Note: You cannot use the OUTINDEX= and READINDEXES= options in the same chart statement.
-
OUTLABEL=VALUE
OUTLABEL=(variable) -
labels each point that falls outside the control limits on the primary chart with the VALUE plotted for that subgroup or with the value of a variable in the input data set.
The variable provided in the input data set can be numeric or character. If the variable is a character variable, it can be up to 16 characters. For each subgroup of observations whose summary statistic falls outside the control limits, the formatted value of the variable in the observations is used to label the point representing the subgroup. If you are reading a DATA= data set with multiple observations per subgroup, the values of the variable should be identical for observations within a subgroup. By default, points are not labeled. The OUTLABEL= option takes precedence over the TESTLABEL= option when TESTS=1 is specified. You cannot specify both the OUTLABEL= and ALLLABEL= options.
-
OUTLABEL2=VALUE
OUTLABEL2=(variable) -
labels each point that falls outside the control limits on an R or s chart with the VALUE plotted for that subgroup or with the value of a variable in the input data set.
The variable provided in the input data set can be numeric or character. If the variable is a character variable, its length cannot exceed 16. For each subgroup of observations whose summary statistic falls outside the control limits, the formatted value of the variable in the observations is used to label the point representing the subgroup. If you are reading a DATA= data set with multiple observations per subgroup, the values of the variable should be identical for observations within a subgroup. By default, points are not labeled. The OUTLABEL2= option takes precedence over the TESTLABEL2= option when TESTS2=1 is specified. You cannot specify both the OUTLABEL2= and ALLLABEL2= options. The OUTLABEL2= option is available only in the IRCHART, MRCHART, RCHART, SCHART, XRCHART, and XSCHART statements.
- OUTLIMITS=SAS-data-set
-
creates an output data set that saves the control limits. You can use an OUTLIMITS= data set as an input LIMITS= data set in a subsequent run of the procedure. See “Output Data Sets” in the section for the chart statement in which you are interested. A related option is OUTINDEX=.
- OUTLOWHTML=variable
-
Traditional Graphicsspecifies a variable whose values create links to be associated with outlier points below the lower fence on a schematic box chart when traditional graphics output is directed into HTML.
- OUTLOWURL=variable
-
ODS Graphicsspecifies a variable whose values are URLs to be associated with outlier points below the lower fence on a schematic box chart when ODS Graphics output is directed into HTML.
- OUTPHASE='label'
-
specifies the value of the
_PHASE_variable in the OUTHISTORY= data set. This is a bookkeeping variable that provides information identifying the summary statistics saved in the data set. See “Output Data Sets” in the section for the chart statement in which you are interested.You should use the OUTPHASE= option if you create OUTHISTORY= data sets at different stages (phases) for the same processes and concatenate the data sets to build a master historical data set. The
_PHASE_variable then identifies the block of observations that corresponds to each phase.The label can be up to 128 characters and should be enclosed in quotes. You should use a label that uniquely identifies the saved data. For example, you might specify OUTPHASE='April 1-15' to indicate that the data were collected during the first half of April.
The
_PHASE_variable is created only if you specify the OUTPHASE= option. If you specify the OUTPHASE= option and do not specify the name of the OUTHISTORY= data set with the OUTHISTORY= option, the procedure creates an OUTHISTORY= data set whose name is of the form WORK.DATAn. - OUTTABLE=SAS-data-set
-
creates an output SAS data set that saves the information plotted on the chart, including the subgroup variable values and their corresponding summary statistics and control limits.
You can use the OUTTABLE= data set to create a customized report with the reporting procedures and methods described in Base SAS Procedures Guide. You can also use an OUTTABLE= data set as a TABLE= input data set in a subsequent run of the procedure. See “Output Data Sets” in the section for the chart statement in which you are interested.
- OVERLAY=(variable-list)
-
Traditional GraphicsODS Graphicsspecifies variables to be overlaid on the primary control chart. A point is plotted for each overlay variable at each subgroup for which it has a non-missing value. The value of a particular overlay variable should be the same for each observation in the input data set with a given value of the subgroup variable. If values differ within a subgroup, the first value appearing in that subgroup is used. The OVERLAY= option cannot be specified with the STARVERTICES= option.
- OVERLAY2=(variable-list)
-
Traditional GraphicsODS Graphicsspecifies variables to be overlaid on a secondary control chart. A point is plotted for each overlay variable at each subgroup for which it has a non-missing value. The value of a particular overlay variable should be the same for each observation in the input data set with a given value of the subgroup variable. If values differ within a subgroup, the first value appearing in that subgroup is used. The OVERLAY2= option cannot be specified with the STARVERTICES= option.
- OVERLAY2HTML=(variable-list)
-
Traditional Graphicsspecifies variables whose values create links to be associated with points on secondary chart overlays. These links are associated with points on an overlay plot when traditional graphics output is directed into HTML. Variables in the OVERLAY2HTML= list are matched with variables in the corresponding positions in the OVERLAY2= list. The value of the OVERLAY2HTML= variable should be the same for each observation with a given value of the subgroup variable.
- OVERLAY2ID=(variable-list)
-
Traditional GraphicsODS Graphicsspecifies variables whose formatted values are used to label points on secondary chart overlays. Variables in the OVERLAY2ID= list are matched with variables in the corresponding positions in the OVERLAY2= list. The value of the OVERLAY2ID= variable should be the same for each observation with a given value of the subgroup variable.
- OVERLAY2SYM=(symbol-list)
-
Traditional Graphicsspecifies symbols used to plot overlays on a secondary control chart. Symbols in the OVERLAY2SYM= list are matched with variables in the corresponding positions in the OVERLAY2= list.
- OVERLAY2SYMHT=(value-list)
-
Traditional Graphicsspecifies the heights of symbols used to plot overlays on a secondary control chart. Heights in the OVERLAY2SYMHT= list are matched with variables in the corresponding positions in the OVERLAY2= list.
- OVERLAY2URL=(variable-list)
-
ODS Graphicsspecifies variables whose values are URLs to be associated with points on secondary chart overlays. These URLs are associated with points on an overlay plot when ODS Graphics output is directed into HTML. Variables in the OVERLAY2URL= list are matched with variables in the corresponding positions in the OVERLAY2= list. The value of the OVERLAY2URL= variable should be the same for each observation with a given value of the subgroup variable.
- OVERLAYCLIPSYM=symbol
-
Traditional Graphicsspecifies the symbol used to plot clipped values on overlay plots when the CLIPFACTOR= option is used.
- OVERLAYCLIPSYMHT=value
-
Traditional Graphicsspecifies the height for the symbol used to plot clipped values on overlay plots when the CLIPFACTOR= option is used.
- OVERLAYHTML=(variable-list)
-
Traditional Graphicsspecifies variables whose values create links to be associated with points on primary chart overlays. These links are associated with points on an overlay plot when traditional graphics output is directed into HTML. Variables in the OVERLAYHTML= list are matched with variables in the corresponding positions in the OVERLAY= list. The value of the OVERLAYHTML= variable should be the same for each observation with a given value of the subgroup variable.
- OVERLAYID=(variable-list)
-
Traditional GraphicsODS Graphicsspecifies variables whose formatted values are used to label points on primary chart overlays. Variables in the OVERLAYID= list are matched with variables in the corresponding positions in the OVERLAY= list. The value of the OVERLAYID= variable should be the same for each observation with a given value of the subgroup variable.
- OVERLAYLEGLAB='label'
-
Traditional GraphicsODS Graphicsspecifies the label displayed to the left of the legend for overlays requested with the OVERLAY= or OVERLAY2= option. The label can be up to 16 characters and must be enclosed in quotes.
- OVERLAYSYM=(symbol-list)
-
Traditional Graphicsspecifies symbols used to plot overlays on the primary control chart. Symbols in the OVERLAYSYM= list are matched with variables in the corresponding positions in the OVERLAY= list.
- OVERLAYSYMHT=(value-list)
-
Traditional Graphicsspecifies the heights of symbols used to plot overlays on the primary control chart. Heights in the OVERLAYSYMHT= list are matched with variables in the corresponding positions in the OVERLAY= list.
- OVERLAYURL=(variable-list)
-
ODS Graphicsspecifies variables whose values are URLs to be associated with points on primary chart overlays. These URLs are associated with points on an overlay plot when ODS Graphics output is directed into HTML. Variables in the OVERLAYURL= list are matched with variables in the corresponding positions in the OVERLAY= list. The value of the OVERLAYURL= variable should be the same for each observation with a given value of the subgroup variable.
- P0=value
-
specifies a known (standard) value
 for the proportion of nonconforming items produced by the process. By default,
  is estimated from the data. The P0= option is available only in the NPCHART and PCHART statements.
Note: As an alternative to specifying P0=
, you can read a predetermined value for from the variable _P_in a LIMITS= data set. See “Input Data Sets” in the section for the chart statement in which you are interested. - PAGENUM='string'
-
Traditional GraphicsODS Graphicsspecifies the form of the label used for pagination.
The string must be no longer than 16 characters, and it must include one or two occurrences of the substitution character #. The first # is replaced with the page number, and the optional second # is replaced with the total number of pages.
The PAGENUM= option is useful when you are working with a large number of subgroups, resulting in multiple pages of output. For example, suppose that each of the following XRCHART statements produces multiple pages:
proc shewhart data=Pistons;
   xrchart Diameter*Hour / pagenum='Page #';
   xrchart Diameter*Hour / pagenum='Page # of #';
   xrchart Diameter*Hour / pagenum='#/#';
run;
The third page produced by the first statement would be labeled Page 3. The third page produced by the second statement would be labeled Page 3 of 5. The third page produced by the third statement would be labeled 3/5.
By default, no page number is displayed.
- PAGENUMPOS=TL | TR | BL | BR | TL100 | TR100 | BL0 | BR0
-
Traditional GraphicsODS Graphicsspecifies where to position the page number requested with the PAGENUM= option. The keywords TL, TR, BL, and BR correspond to the positions top left, top right, bottom left, and bottom right, respectively. You can use the TL100 and TR100 keywords to ensure that the page number appears at the very top of a page when a title is displayed. The BL0 and BR0 keywords ensure that the page number appears at the very bottom of a page when footnotes are displayed. The default keyword is BR.
- PCTLDEF=index
-
specifies one of five definitions used to calculate percentiles in the construction of box-and-whisker plots requested with the BOXCHART statement. The index can be 1, 2, 3, 4, or 5. The five corresponding percentile definitions are discussed in Percentile Definitions. The default index is 5. The PCTLDEF= option is available only in the BOXCHART statement.
- PHASEBOXLABELS
-
ODS Graphicsdraws phase labels as titles along the top of phase boxes.
- PHASEBREAK
-
specifies that the last point in a phase (defined as a block of consecutive subgroups with the same value of the
_PHASE_variable) is not to be connected to the first point in the next phase. By default, the points are connected. -
PHASELABTYPE=SCALED | TRUNCATED
PHASELABTYPE=height -
Traditional GraphicsODS Graphicsspecifies how lengthy
_PHASE_variable values are to be displayed when there is insufficient space in the legend requested with the PHASELEGEND option. By default, lengthy values are not displayed.If you specify PHASELABTYPE=SCALED, the values are uniformly reduced in height so that they fit. If you specify PHASELABTYPE=TRUNCATED, lengthy values are truncated on the right until they fit. When producing traditional graphics, you can also specify a text height in vertical percent screen units for the values. Related options are PHASELEGEND and PHASEREF.
-
PHASELEGEND
PHASELEG -
identifies the phases requested with the READPHASES= option in a legend across the top of the chart. Related options are PHASELABTYPE= and PHASEREF.
- PHASELIMITS
-
specifies that the control limits and center line are to be labeled for each phase specified with the READPHASES= option, providing the limits are constant within that phase.
-
PHASEMEANSYMBOL=symbol
PHASEMEAN -
Traditional GraphicsODS Graphicsspecifies a symbol marker for the average of the values plotted within a phase. Specify PHASEMEAN without an argument to plot the phase average in ODS Graphics output. This option is available only in the BOXCHART statement.
- PHASEPOS=n
-
ODS Graphicsspecifies the vertical position of the phase legend. Values of n and the corresponding positions are as follows. By default, PHASEPOS=1.
n
Legend Position
1
Top of chart, offset from axis frame
2
Top of chart, immediately above axis frame
3
Bottom of chart, immediately above horizontal axis
4
Bottom of chart, below horizontal axis label
- PHASEREF
-
delineates the phases specified with the READPHASES= option with reference lines drawn vertically. Related options are PHASELABTYPE= and PHASELEGEND.
- PHASEREFLEVEL=INNER | OUTER | NONE
-
ODS Graphicsenables you to associate phase reference lines (block reference lines) with either the innermost or the outermost level. The default value is INNER.
- PHASEVARLABEL
-
displays the label associated with the variable
_PHASE_above the phase values in the phase legend. If there is no label associated with_PHASE_, or if the PHASELEGEND option is not specified, PHASEVARLABEL has no effect. - PHASEVALSEP
-
displays vertical lines separating phase values in the phase legend. If the PHASELEGEND option is not specified, PHASEVALSEP has no effect.
- POINTSHTML=variable
-
Traditional Graphicsspecifies a variable whose values create links to be associated with points on a box chart when the BOXSTYLE= value is POINTS, POINTSJOIN, POINTSBOX, POINTSID, or POINTSJOINID. These URLs are associated with points on a box chart when traditional graphics output is directed into HTML.
- POINTSURL=variable
-
ODS Graphicsspecifies a variable whose values are URLs to be associated with points on a box chart when the BOXSTYLE= value is POINTS, POINTSJOIN, POINTSBOX, POINTSID, or POINTSJOINID. These URLs are associated with points on a box chart when ODS Graphics output is directed into HTML.
-
PSYMBOL='label'
PSYMBOL=P | PBAR | PPM | PPM2 | P0 -
specifies a label for the central line in a p chart. You can use the option in the following ways:
-
Specify a quoted label up to 16 characters.
-
Specify one of the keywords listed in the following table. Each keyword requests a label of the form symbol=value, where symbol is the symbol given in the table, and value is the value of the central line. If the central line is not constant, only the symbol is displayed.
Symbol Used in
Keyword
Graphics
Line Printer Charts
P
P
P
PBAR

PPM

PPM2

P0

P0
The default keyword is PBAR. The PSYMBOL= option is available only in the PCHART statement.
-
- RANGES
-
estimates the process standard deviation for a boxplot using subgroup ranges. By default, the process standard deviation for a boxplot is estimated from the subgroup standard deviations.
- READALPHA
-
specifies that the variable
_ALPHA_, rather than the variable_SIGMAS_, is to be read from a LIMITS= data set when both variables are available in the data set. Thus, the limits displayed are probability limits. If you do not specify the READALPHA option, then_SIGMAS_is read by default. For details, see “Input Data Sets” in the section for the chart statement in which you are interested. -
READINDEX=value-list | ALL
READINDEXES=value-list | ALL
READINDICES=value-list | ALL -
reads one or more sets of control limits from a LIMITS= data set (specified in the PROC SHEWHART statement) for each process listed in the chart statement. The ith set of control limits for a particular process is read from the first observation in the LIMITS= data set for which
-
the value of
_VAR_matches process -
the value of
_SUBGRP_matches the subgroup variable -
the value of
_INDEX_matches value
The values can be up to 128 characters and must be enclosed in quotes.
Note: You cannot use the READINDEX= and OUTINDEX= options in the same chart statement. Also, the READLIMITS and READINDEX= options are alternatives to each other. If the LIMITS= data set contains more than one set of control limits for the same process, you should use the READINDEX= option.
You can display distinct sets of control limits (read from a LIMITS= data set) with data for various phases (read from blocks of observations in the input data set) by using the READINDEXES= and READPHASES= options together. See the entry for the READPHASES= option.
For more information about multiple sets of control limits and about the keyword ALL, see Displaying Multiple Sets of Control Limits.
-
- READLIMITS
-
specifies that the control limits are to be read from a LIMITS= data set specified in the PROC SHEWHART statement.[90] The control limits for each process listed in the chart statement are to be read from the first observation in the LIMITS= data set where
-
the value of
_VAR_matches process -
the value of
_SUBGRP_matches the subgroup variable
The use of the READLIMITS option depends on the release of SAS/QC software that you are using.
-
In SAS 6.10 and later releases, the READLIMITS option is not necessary. To read control limits as described previously, you simply specify a LIMITS= data set. However, even though the READLIMITS option is redundant, it continues to function as in earlier releases. Consequently, the following two XRCHART statements are equivalent:
proc shewhart data=Pistons limits=Diamlim;
   xrchart Diameter*Hour;
   xrchart Diameter*Hour / readlimits;
run;
If the LIMITS= data set contains more than one set of control limits for the same process, you should use the READINDEX= option.
-
In SAS 6.09 and earlier releases, you must specify the READLIMITS option to read control limits as described previously. If you specify a LIMITS= data set without specifying the READLIMITS option (or the READINDEX= option), the control limits are computed from the data. Consequently, the following two XRCHART statements are not equivalent:
proc shewhart data=Pistons limits=diamlim;
   xrchart Diameter*Hour;  /* limits computed from data */
   xrchart Diameter*Hour /
      readlimits;          /* limits read from DIAMLIM  */
run;
The READLIMITS and READINDEX= options are alternatives to each other.
You can use the READLIMITS and READPHASES= options together. In this case, the control limits are read as described previously, and the data plotted on the chart are those selected by the READPHASES= option.
-
-
READPHASES=value-list | ALL
READPHASE=value-list | ALL -
selects blocks of consecutive observations to be read from the input data set. You can use the READPHASES= option only if
-
the input data set contains a
_PHASE_variable -
the
_PHASE_variable is a character variable of no more than 128 characters
The READPHASES= option selects those observations whose
_PHASE_value matches one of the values specified in the value-list. The block of consecutive observations identified by the ith value is referred to as the ith phase. The values can be up to 128 characters and must be enclosed in quotes. List the values in the same order that they appear as values of the variable_PHASE_in the input data set.With the READPHASES= option you can
-
create control charts that label blocks of data corresponding to multiple time phases. See the PHASELEGEND, PHASEREF, and CFRAME= options.
-
create historical control charts that display distinct sets of control limits for different phases. This also requires a LIMITS= data set and the READINDEXES= option.
If the subgroup variable is numeric, the values of the subgroup variable should be contiguous from one block of observations to the next. Otherwise, there may be a gap in the control chart between the last point in one phase and the first point in the next phase. If you read a data set that contains multiple observations for each subgroup, the value of
_PHASE_must be constant within the subgroup.You can display distinct sets of control limits (read from a LIMITS= data set) with data for various phases by using the READINDEX= and READPHASES= options together. For example, consider the flange width data in the HISTORY= data set
Flangeand the LIMITS= data setFlangelim. A partial listing ofFlangeis given in Figure 17.136 (for a complete listing ofFlange, see Figure 17.148). The complete listing ofFlangelimis given in Figure 17.137.proc print data=Flange; var _phase_ Day Sample FlangewidthX FlangewidthR FlangewidthN; run;
Figure 17.136: Listing of the HISTORY= Data Set
FlangeMean Chart for Diameters Obs _phase_ Day Sample FlangewidthX FlangewidthR FlangewidthN 1 Production 08FEB90 6 0.97360 0.06247 5 2 Production 09FEB90 7 1.00486 0.11478 5 3 Production 10FEB90 8 1.00251 0.13537 5 4 Production 11FEB90 9 0.95509 0.08378 5 5 Production 12FEB90 10 1.00348 0.09993 5 6 Production 15FEB90 11 1.02566 0.06766 5 7 Production 16FEB90 12 0.97053 0.07608 5 8 Production 17FEB90 13 0.94713 0.10170 5 9 Production 18FEB90 14 1.00377 0.04875 5 10 Production 19FEB90 15 0.99604 0.08242 5 11 Change 1 22FEB90 16 0.99218 0.09787 5 12 Change 1 23FEB90 17 0.99526 0.02017 5 13 Change 1 24FEB90 18 1.02235 0.10541 5 14 Change 1 25FEB90 19 0.99950 0.11476 5 15 Change 1 26FEB90 20 0.99271 0.05395 5 16 Change 1 01MAR90 21 0.98695 0.03833 5 17 Change 1 02MAR90 22 1.00969 0.06183 5 18 Change 1 03MAR90 23 0.98791 0.05836 5 19 Change 1 04MAR90 24 1.00170 0.05243 5 20 Change 1 05MAR90 25 1.00412 0.04815 5 21 Change 2 08MAR90 26 1.00261 0.05604 5 22 Change 2 09MAR90 27 0.99553 0.02818 5 23 Change 2 10MAR90 28 1.01463 0.05558 5 24 Change 2 11MAR90 29 0.99812 0.03648 5 25 Change 2 12MAR90 30 1.00047 0.04309 5 26 Change 2 15MAR90 31 0.99714 0.03689 5 27 Change 2 16MAR90 32 0.98642 0.04809 5 28 Change 2 17MAR90 33 0.98891 0.07777 5 29 Change 2 18MAR90 34 1.00087 0.06409 5 30 Change 2 19MAR90 35 1.00863 0.02649 5
proc print data=Flangelim;
   var _index_ _var_ _subgrp_ _type_ _limitn_ _alpha_ _sigmas_
       _lclx_ _mean_ _uclx_ _lclr_ _r_ _uclr_ _stddev_;
run;
Figure 17.137: Listing of the LIMITS= Data Set
FlangelimMean Chart for Diameters Obs _index_ _var_ _subgrp_ _type_ _limitn_ _alpha_ _sigmas_ _lclx_ _mean_ _uclx_ _lclr_ _r_ _uclr_ _stddev_ 1 Change 1 Flangewidth Sample ESTIMATE 5 .0026998 3 0.96167 0.99924 1.03680 0 0.06513 0.13771 0.028000 2 Production Flangewidth Sample ESTIMATE 5 .0026998 3 0.93792 0.98827 1.03862 0 0.08729 0.18458 0.037530 3 Start Flangewidth Sample ESTIMATE 5 .0026998 3 0.87088 0.96803 1.06517 0 0.16842 0.35612 0.072409
The following statements use the READINDEX= and READPHASES= options to create a historical control chart for the Production and Change 1 phases:
ods graphics on;
proc shewhart history=Flange limits=Flangelim;
   xchart Flangewidth*Sample /
      readphases  = ('Production' 'Change 1')
      readindexes = ('Production' 'Change 1')
      phaseref
      phaselegend;
run;
ods graphics off;
The chart is displayed in Figure 17.138.
Figure 17.138: Multiple Control Limits for Multiple Phases
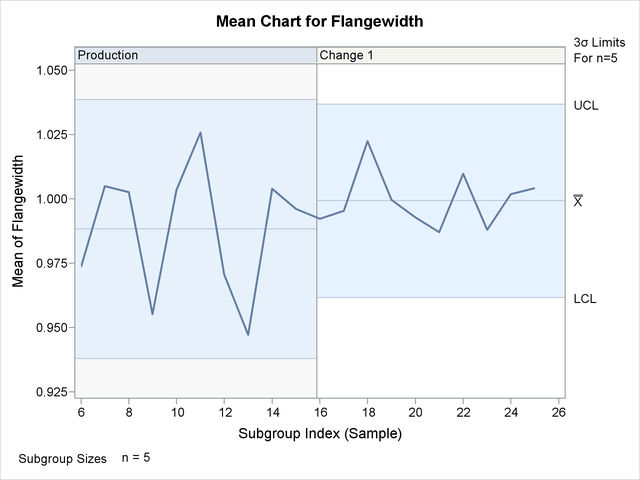
You can also use the keyword ALL with the READPHASES= option to match control limits to phases. For more information and examples about specifying multiple control limits, including the use of the keyword ALL, see Displaying Multiple Sets of Control Limits.
-
-
REPEAT
REP -
specifies that the horizontal axis of a chart that spans multiple pages is to be arranged so that the last subgroup position on a page is repeated as the first subgroup position on the next page. The REPEAT option facilitates cutting and pasting panels together. If a SAS DATETIME format is associated with the subgroup variable, REPEAT is used by default.
-
RSYMBOL='label'
RSYMBOL=R | RBAR | RPM | R0 -
specifies a label for the central line in an R chart. You can use the option in the following ways:
-
You can specify a quoted label up to 16 characters.
-
You can specify one of the keywords listed in the following table. Each keyword requests a label of the form symbol=value, where symbol is the symbol given in the table, and value is the value of the central line. If the central line is not constant, only the symbol is displayed.
Symbol Used in
Keyword
Graphics
Line Printer Charts
R
R
R
RBAR

RPM

R0

R0
The default keyword is RBAR. The RSYMBOL= option is available only in the IRCHART, MRCHART, RCHART, and XRCHART statements.
-
-
RTMARGIN=value
RTM=value -
Traditional GraphicsODS Graphicsspecifies the width of the right marginal area for the plot requested with the RTMPLOT= option. For traditional graphics, the width is specified in horizontal percent screen units. For ODS Graphics output, the width is specified in pixels. The RTMARGIN= option is available only in the IRCHART statement.
- RTMPLOT=keyword
-
Traditional GraphicsODS Graphicsrequests a univariate plot of the control chart statistics that is positioned in the right margin of the control chart. The keywords that you can specify and the associated plots are listed in the following table:
Keyword
Marginal Plot
DIGIDOT
digidot plot
HISTOGRAM
histogram
SKELETAL
skeletal box-and-whisker plot
SCHEMATIC
schematic box-and-whisker plot
SCHEMATICID
schematic box-and-whisker plot with outliers labeled
SCHEMATICIDFAR
schematic box-and-whisker plot with far outliers labeled
The RTMPLOT= option is available only in the IRCHART statement; see Example 17.13 for an example. Refer to Hunter (1988) for a description of digidot plots, and see the entry for the BOXSTYLE= option for a description of the various box-and-whisker plots. Related options are LTMARGIN=, LTMPLOT=, and RTMARGIN=.
- SEPARATE
-
displays primary and secondary charts on separate screens or pages. This option is useful if you are displaying line printer charts on a terminal and the number of lines on the screen limits the resolution of the chart. The SEPARATE option is available only in the IRCHART, MRCHART, XRCHART, and XSCHART statements.
- SERIFS
-
adds serifs to the whiskers of skeletal box-and-whisker charts. The SERIFS option is available only in the BOXCHART statement.
- SIGMA0=value
-
specifies a known (standard) value
 for the process standard deviation . By default, is estimated from the data.
The SIGMA0= option is available in the BOXCHART, IRCHART, MCHART, MRCHART, RCHART, SCHART, XCHART, XRCHART, and XSCHART statements.
Note: As an alternative to specifying SIGMA0=
, you can read a predetermined value for from the variable _STDDEV_in a LIMITS= data set. For details, see “Input Data Sets” in the section for the chart statement in which you are interested. - SIGMAS=k
-
specifies the width of the control limits in terms of the multiple k of the standard error of the subgroup summary statistic plotted on the chart. The value of k must be positive. By default, k = 3 and the control limits are “
limits.”
The particular subgroup summary statistic whose standard error is multiplied by k depends on the chart statement, as indicated by the following table:
Statement
Subgroup Summary Statistic
BOXCHART
mean or median
CCHART
number nonconforming
IRCHART
individual measurements and moving ranges
MCHART
median
MRCHART
median and range
NPCHART
number nonconforming
PCHART
proportion nonconforming
RCHART
range
SCHART
standard deviation
UCHART
number of nonconformities per unit
XCHART
mean
XRCHART
mean and range
XSCHART
mean and standard deviation
For details, see the Options for Specifying Control Limits table and the “Details” subsection in the section for the particular chart statement that you are using.
Note that
-
as an alternative to specifying SIGMAS=k, you can read k from the variable
_SIGMAS_in a LIMITS= data set. For details, see “Input Data Sets” in the section for the chart statement in which you are interested. -
as an alternative to specifying SIGMAS=k (or reading
_SIGMAS_from a LIMITS= data set), you can request probability limits by specifying ALPHA= (or reading the variable _ALPHA_from a LIMITS= data set by specifying the READALPHA option).
-
- SIMULATEQCFONT
-
ODS Graphicsdraws the central line labels using a simulated software font rather than a hardware font.
-
SKIPHLABELS=n
SKIPHLABEL=n -
Traditional GraphicsLine Printerspecifies the number n of consecutive tick mark labels, beginning with the second tick mark label, that are thinned (not displayed) on the horizontal (subgroup) axis. For example, specifying SKIPHLABEL=1 causes every other label to be skipped (not displayed). Specifying SKIPHLABEL=2 causes the second and third labels to be skipped, the fifth and sixth labels to be skipped, and so forth.
The default value of the SKIPHLABELS= option is the smallest value n for which tick mark labels do not collide. A specified n will be overridden to avoid collision, unless you specify SKIPHLABELS=0, which forces all tick mark labels to be displayed. To avoid both collisions and thinning, you can use the TURNHLABELS option.
- SMETHOD=NOWEIGHT | MVLUE | RMSDF | MAD | MMR | MVGRANGE
-
specifies a method for estimating the process standard deviation,
, as summarized by the following table:
Keyword
Method for Estimating Standard Deviation
NOWEIGHT
estimates
as an unweighted average of unbiased subgroup estimates of
MVLUE
calculates a minimum variance linear unbiased estimate for
RMSDF
calculates a root-mean square estimate for
MAD
calculates a median absolute deviation estimate for
(IRCHART only)
MMR
calculates a median moving range estimate for
(IRCHART only)
MVGRANGE
estimates
based on a moving range of subgroup means (XRCHART and XSCHART only)
For formulas, see “Methods for Estimating the Process Standard Deviation” in the section for the particular chart statement you are using.
The default keyword is NOWEIGHT. The SMETHOD= option is available in the BOXCHART, IRCHART, MCHART, MRCHART, RCHART, SCHART, XCHART, XRCHART, and XSCHART statements. You can specify SMETHOD=RMSDF only in the BOXCHART, MCHART, XCHART, SCHART, and XSCHART statements and only when used with the STDDEVIATIONS option (or only in the absence of the RANGES option with a BOXCHART statement). You can specify SMETHOD=MAD and SMETHOD=MMR only in the IRCHART statement. You can specify SMETHOD=MVGRANGE only in the XRCHART and XSCHART statements.
- SPLIT='character'
-
specifies a special character that is inserted into the label of a process variable or summary statistic variable and whose purpose is to split the label into two parts. The first part is used to label the vertical axis of the primary chart, and the second part is used to label the vertical axis of the secondary chart. The character is not displayed in either label. See Figure 17.172 for an example.
The SPLIT= option is available in the IRCHART, MRCHART, XRCHART, and XSCHART statements and in the BOXCHART, MCHART, and XCHART statements with the TRENDVAR= option.
-
SSYMBOL='label'
SSYMBOL=S | SBAR | SPM | S0 -
specifies a label for the central line in an s chart. You can use the option in the following ways:
-
You can specify a quoted label up to 16 characters.
-
You can specify one of the keywords listed in the following table. Each keyword requests a label of the form symbol=value, where symbol is the symbol given in the table, and value is the value of the central line. If the central line is not constant, only the symbol is displayed.
Symbol Used in
Keyword
Graphics
Line Printer Charts
S
S
S
SBAR

SPM

S0

S0
The default keyword is SBAR. The SSYMBOL= option is available only in the SCHART and XSCHART statements.
-
- STARBDRADIUS=value
-
Traditional GraphicsODS Graphicsspecifies the radius of an imaginary circle that is the outer bound for vertices of stars requested with the STARVERTICES= option. For traditional graphics, the radius is specified in horizontal percent screen units. For ODS Graphics output, the radius is specified in pixels. Vertices that exceed the outer bound are truncated to this value in order to prevent gross distortion of stars due to extreme values in the data. The value must be greater than or equal to the value specified with the STAROUTRADIUS= option. See Figure 17.140 or Displaying Auxiliary Data with Stars.
- STARCIRCLES=values
-
Traditional Graphicsspecifies reference circles that are superimposed on the stars requested with the STARVERTICES= option. All of the circles are displayed and centered at each point plotted on the primary chart. The value determines the diameter of the circle as follows: a value of zero specifies a circle with the inner radius, and a value of one specifies a circle with the outer radius. In general, a value of h specifies a circle with a radius equal to
 .
.
Figure 17.139 shows four circles specified with the STARCIRCLES= option. The values 0.0 and 1.0 correspond to the inner circle and outer circle (see the entries for the STARINRADIUS= and STAROUTRADIUS= options). The value 0.5 specifies a circle with a radius of
 or a circle halfway between the inner circle and the outer circle. Likewise, the value 0.25 specifies a circle one-fourth
of the way from the inner circle to the outer circle. Note also that the line types for the circles are specified with the
LSTARCIRCLES= option. For more information, see Displaying Auxiliary Data with Stars.
or a circle halfway between the inner circle and the outer circle. Likewise, the value 0.25 specifies a circle one-fourth
of the way from the inner circle to the outer circle. Note also that the line types for the circles are specified with the
LSTARCIRCLES= option. For more information, see Displaying Auxiliary Data with Stars.
Figure 17.139: Circles Specified by STARCIRCLES=0.0 1.0 0.25 0.5
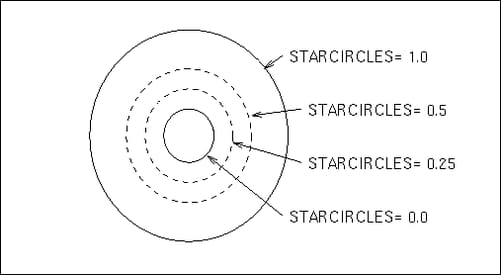
- STARINRADIUS=value
-
Traditional GraphicsODS Graphicsspecifies the inner radius of stars requested with the STARVERTICES= option. For traditional graphics, the radius is specified in horizontal percent screen units. For ODS Graphics output, the radius is specified in pixels. The value must be less than the value that is specified with the STAROUTRADIUS= option. The inner radius of a star is the distance from the center of the star to the circle that represents the lower limit of the standardized vertex variables. The lower limit can correspond to the minimum value, a multiple of standard deviations below the mean, or a lower specification limit. The default value is one-third of the outer radius.
Figure 17.140 illustrates five of the star options. The STARSTART= option determines the angle between the vertical axis and the first vertex. The STARINRADIUS= and STAROUTRADIUS= options specify the radii (in horizontal percent screen units) of the inner and outer circles that are associated with each star. Extremely large vertex values are truncated at the imaginary circle whose radius is specified by the STARBDRADIUS= option. The STARTYPE=RADIAL option specifies that the vertices are to be displayed as endpoints of line segments connecting each vertex to the center point. For more information, see the entries for these options or Displaying Auxiliary Data with Stars.
Figure 17.140: Illustration of Star Options
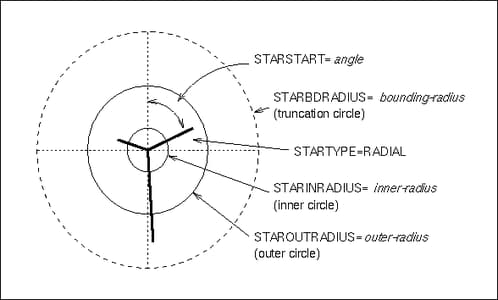
- STARFILL=variable
-
Traditional GraphicsODS Graphicsspecifies colors for filling the interior of stars requested with the STARVERTICES= option. The STARFILL= option is analogous to the CSTARFILL= option, but the values of the STARFILL= variable are used only to group the stars. Stars in the same group are filled with the same color from the ODS style.
- STARLABEL=ALL | FIRST | HIGH | LOW | OUT
-
Traditional GraphicsODS Graphicsspecifies a method for labeling the vertices of stars requested with the STARVERTICES= option. The following table describes the method corresponding to each keyword:
Keyword
Method for Labeling Star Vertices
ALL
labels all vertices of all stars
FIRST
labels all vertices of the leftmost star
HIGH
labels only vertices that lie outside the outer circle
LOW
labels only vertices that lie inside the inner circle
OUT
labels only vertices that lie inside the inner circle or outside the outer circle
The label used for a particular vertex is the value of the variable
_LABEL_in the STARSPECS= data set. If this data set is not specified, or if the_LABEL_variable is not provided, then the name of the vertex variable is used as the label. See Displaying Auxiliary Data with Stars. By default, vertices are not labeled. - STARLEGEND=CLOCK | CLOCK0 | DEGREES | NONE
-
Traditional GraphicsODS Graphicsspecifies the style of the legend used to identify the vertices of stars requested with the STARVERTICES= option. The following table describes the method corresponding to each keyword:
Keyword
Star Vertices Legend Style
CLOCK
identifies the vertex variables by their positions on the clock (starting with 12:00)
CLOCK0
identifies the vertex variables by their positions on the clock (starting with 0:00)
DEGREES
identifies the vertex variables by angles in degrees, with 0 degrees corresponding to 12 o’clock
NONE
suppresses the legend
See Displaying Auxiliary Data with Stars. The default keyword is CLOCK.
- STARLEGENDLAB='label'
-
Traditional GraphicsODS Graphicsspecifies the label displayed to the left of the legend for stars requested with the STARLEGEND= option. The label can be up to 16 characters and must be enclosed in quotes. See Displaying Auxiliary Data with Stars. The default label is Vertices:.
- STARTRANSPARENCY=value
-
ODS Graphicsspecifies the star fill transparency when transparency is used in ODS Graphics output. The value must be between 0 and 1, where 0 is completely opaque and 1 is completely transparent. The default star fill transparency is 0.25.
- STAROUTRADIUS=value
-
Traditional GraphicsODS Graphicsspecifies the outer radius of stars requested with the STARVERTICES= option. For traditional graphics, the radius is specified in horizontal percent screen units. For ODS Graphics output, the radius is specified in pixels. The outer radius of a star is the distance from the center of the star to the circle that represents the upper limit of the standardized vertex variables. The upper limit can correspond to the maximum value, a multiple of standard deviations above the mean, or an upper specification limit.
See Figure 17.140 Displaying Auxiliary Data with Stars. For an example, see Figure 17.222. The default value depends on the number of subgroup positions per panel, and it is as large as possible without causing overlap of adjacent stars.
- STARS=variable
-
Traditional GraphicsODS Graphicsspecifies colors for the outlines of stars requested with the STARVERTICES= option. The STARS= option is analogous to the CSTARS= option, but the values of the STARS= variable are used only to group the stars. The outlines of stars in the same group are drawn with the same color from the ODS style.
-
STARSPECS=value|SAS-data-set
STARSPEC=value|SAS-data-set -
Traditional GraphicsODS Graphicsspecifies the method used to standardize the star vertex variables listed with the STARVERTICES= option. The method determines how the value of a vertex variable is transformed to determine the distance between the center of the star and the vertex. The STARSPECS= option also determines how the inner and outer radii of the star are to be interpreted.
A value of zero specifies standardization by the range of the variable. In this case, the distance between the center and the vertex is proportional to the difference between the variable value and the minimum variable value (taken across all subgroups). The inner radius of the star corresponds to the minimum variable value, and the outer radius of the star corresponds to the maximum variable value.
A positive STARSPECS= value requests standardization by a multiple of standard deviations above and below the mean. For example, STARSPECS=3 specifies that the inner radius of the star corresponds to three standard deviations below the mean, and the outer radius corresponds to three standard deviations above the mean. Thus, a vertex variable value exactly equal to the mean is represented by a vertex whose distance to the center of the star is halfway between the inner and outer radii.
You can request a distinct method of standardization for each vertex variable by specifying a STARSPECS= data set. Each observation provides standardization and related information for a distinct vertex variable. The variables read from a STARSPECS= data set are described in the following table:
Variable
Description
_CSPOKE_color of spokes used with STARTYPE=RADIAL and STARTYPE=SPOKE; this must be a character variable of length 8 or less
_LABEL_label for identifying the vertex when you specify STARLEGEND=FIRST or STARLEGEND=ALL; this must be a character variable of up to 16 characters
_LSL_lower specification limit
_LSPOKE_line style for spokes used with STARTYPE=RADIAL, STARTYPE=SPOKE, and STARTYPE=WEDGE
_NOMVAL_nominal value substituted for missing values
_SIGMAS_multiple of standard deviations above and below the average
_UBOUND_upper bound for truncating extremely high values
_USL_upper specification limit
_VAR_name of vertex variable; this must be a character variable of length 32 or less
Only the variable
_VAR_is mandatory. If you provide the variables_LSL_and_USL_, standardization is based on the specification limits; in this case, the variable_LSL_corresponds to the inner radius of the star, and the variable_USL_corresponds to the outer radius of the star. If you do not provide the variables_LSL_and_USL_, standardization is based on the value of the variable_SIGMAS_, and if you do not provide the variable_SIGMAS_, standardization is based on the range.See Displaying Auxiliary Data with Stars. If you do not specify the STARSPECS= option, each vertex variable is standardized by its range across subgroups. In other words, the minimum corresponds to the inner radius, and the maximum corresponds to the outer radius.
- STARSTART=value
-
Traditional GraphicsODS Graphicsspecifies the vertex angle for the first variable in the STARVERTICES= list. Vertex angles for the remaining variables are uniformly spaced clockwise and assigned in the order listed. You can specify the value in the following ways:
-
Clock position: If you specify the value as a time literal (between '0:00'T and '12:00'T), the corresponding clock position is used for the first vertex variable.
-
Degrees: If you specify the value as a nonpositive number, the absolute value in degrees is used for the first vertex angle. Here, 0 degrees corresponds to 12:00.
The default value is zero, so the first vertex variable is positioned at 12:00. See Figure 17.140 or Displaying Auxiliary Data with Stars.
-
- STARTYPE=CORONA | POLYGON | RADIAL | SPOKE | WEDGE
-
Traditional GraphicsODS Graphicsspecifies the style of the stars requested with the STARVERTICES= option. The following table describes the method corresponding to each keyword.
Keyword
Star Style
CORONA
polygon with star-vertices emanating from the inner circle
POLYGON
closed polygon
RADIAL
rays emanating from the center
SPOKE
rays emanating from the inner circle
WEDGE
closed polygon with rays from the center to each vertex
See Figure 17.140 or Displaying Auxiliary Data with Stars. Adding Reference Circles to Stars describes the inner and outer circles, and Specifying the Style of Stars provides examples of each value of the STARTYPE= option. The default keyword is POLYGON.
- STARVERTICES=variable | (variable-list)
-
Traditional GraphicsODS Graphicssuperimposes a star (polygon) at each point on the primary chart. The star is centered at the point, and the distance between the center and each star vertex represents the standardized value of a variable in the STARVERTICES= list. The variables must be provided in the input data set.
The star display is suggested as a method for monitoring quantitative variables (such as environmental factors) that are measured simultaneously with the process variable. For examples and details, see Displaying Auxiliary Data with Stars. By default, stars are not superimposed on the chart.
-
STDDEVIATIONS
STDDEVS -
specifies that the estimate of the process standard deviation
is to be calculated from subgroup standard deviations. This, in turn, affects the calculation of control limits; for details,
see “Methods for Estimating the Process Standard Deviation” in the section for the chart statement in which you are interested. By default, the estimate of is calculated from subgroup ranges, except with the BOXCHART statement, where subgroup standard deviations are used by default.
If you specify the STDDEVIATIONS option and read summary data from a HISTORY= data set, the data set must contain a subgroup standard deviation variable for each process. Conversely, if you omit the STDDEVIATIONS option, the HISTORY= data set must contain a subgroup range variable for each process listed in the chart statement.
You should specify STDDEVIATIONS when your subgroup sample sizes are large (typically, 15 or greater). The STDDEVIATIONS option is available only in the MCHART and XCHART statements.
-
SUBGROUPN=value
SUBGROUPN=variable -
specifies the subgroup sample sizes as a constant value or as the values of a variable in the DATA= data set. The SUBGROUPN= option is available only in the CCHART, NPCHART, PCHART, and UCHART statements.
You must specify SUBGROUPN= in the NPCHART, PCHART, and UCHART statements when your input data set is a DATA= data set. If you are using a CCHART statement, the SUBGROUPN= option is available only when your input data set is a DATA= data set. For the CCHART statement, the default value of the SUBGROUPN= option is one.
If you specify multiple processes in a chart statement, the SUBGROUPN= option is used with all of the processes listed.
- SYMBOLCHARS='character-list'
-
Line Printer specifies a list of characters used to mark the points plotted on line printer charts when a symbol-variable is used. See Displaying Stratification in Levels of a Classification Variable.
Each character is associated with a level (unique value) of the symbol-variable and is used to mark points associated with that value. For example, consider the following statements:
proc shewhart;
   xrchart Gap*Shift=Machine / symbolchars='12345';
run;
Here the symbol-variable is
Machine. The and R charts use a '1' to mark points associated with the first unique value of
 Machine, a '2' to mark points associated with the second unique value ofMachine, and so on.If the number of levels of the symbol-variable exceeds the number of characters, the last character listed is used for points associated with the additional values. Thus, in the preceding example, if there are six levels of
Machine, points with the fifth and six values are indicated by '5'.The default character-list is ABCDEFGHIJKLMNOPQRSTUVWXYZ*. Thus, the procedure uses 'A' for the first unique value of the symbol-variable, 'B' for the second unique value, and so on. An asterisk is used for points associated with the 27th and subsequent levels when the symbol-variable has more than 26 levels.
-
SYMBOLLEGEND=LEGENDn
SYMBOLLEGEND=NONE -
Traditional GraphicsODS Graphics controls the legend for the levels of a symbol-variable (see Displaying Stratification in Levels of a Classification Variable). For traditional graphics, you can specify SYMBOLLEGEND=LEGENDn, where n is the number of a LEGEND statement defined previously. You can specify SYMBOLLEGEND=NONE to suppress the default legend.
-
SYMBOLORDER=DATA | INTERNAL | FORMATTED
SYMORD=DATA | INTERNAL | FORMATTED -
Traditional GraphicsLine Printerspecifies the order in which symbols are assigned for levels of symbol-variable. The DATA keyword assigns symbols to values in the order in which values appear in the input data. This is how symbols were assigned in SAS 6.12 and earlier releases of SAS/QC software. The INTERNAL keyword assigns symbols based on sorted order of internal values of symbol-variable and FORMATTED assigns them based on sorted formatted values. The default value is FORMATTED.
-
TABLE <(EXCEPTIONS)>
TABLES <(EXCEPTIONS)> -
creates a basic table of the subgroup values, the subgroup sample sizes, the subgroup summary statistics, and the upper and lower control limits. Rows of the table correspond to subgroups. The keyword EXCEPTIONS (enclosed in parentheses) is optional and restricts the tabulation to those subgroups for which the control limits are exceeded or a test for special causes is positive.
You can request extended versions of the basic table by specifying one or more of the following options: TABLEBOX, TABLECENTRAL, TABLEID, TABLELEGEND, TABLEOUTLIM, and TABLETESTS. Specifying the TABLEALL option is equivalent to specifying all of these options, and it provides the most extensive table.
- TABLEALL <(EXCEPTIONS)>
-
tabulates the information about the control chart and is equivalent to specifying all of the following options: TABLES, TABLECENTRAL, TABLEID, TABLELEGEND, TABLEOUT, and TABLETESTS. If you specify the TABLEALL option in a BOXCHART statement, the TABLEBOX option is also implied. The keyword EXCEPTIONS (enclosed in parentheses) is optional and restricts the tabulation to those subgroups for which the control limits are exceeded or a test for special causes is positive. You can use the OUTTABLE= option to create a data set that saves the information tabulated with the TABLEALL option.
- TABLEBOX <(EXCEPTIONS)>
-
augments the basic table created by the TABLES option with columns for the minimum, 25th percentile, median, 75th percentile, and maximum of the observations in a subgroup. The TABLEBOX option is available only in the BOXCHART statement. The keyword EXCEPTIONS (enclosed in parentheses) is optional and restricts the tabulation to those subgroups for which the control limits are exceeded or a test for special causes is positive.
-
TABLECENTRAL <(EXCEPTIONS)>
TABLEC <(EXCEPTIONS)> -
augments the basic table created by the TABLES option with columns for the values of the central lines. The keyword EXCEPTIONS (enclosed in parentheses) is optional and restricts the tabulation to those subgroups for which the control limits are exceeded or a test for special causes is positive.
- TABLEID <(EXCEPTIONS)>
-
augments the basic table created by the TABLES option with a column for each of the ID variables. The keyword EXCEPTIONS (enclosed in parentheses) is optional and restricts the tabulation to those subgroups for which the control limits are exceeded or a test for special causes is positive.
-
TABLELEGEND <(EXCEPTIONS)>
TABLELEG <(EXCEPTIONS)> -
adds a legend to the basic table created by the TABLES option. The legend describes the tests for special causes that were requested with the TESTS= option and for which a positive signal is found for at least one subgroup. The keyword EXCEPTIONS (enclosed in parentheses) is optional and restricts the tabulation to those subgroups for which the control limits are exceeded or a test for special causes is positive.
-
TABLEOUTLIM <(EXCEPTIONS)>
TABLEOUT <(EXCEPTIONS)> -
augments the basic table created by the TABLES option with columns indicating which control limits (if any) are exceeded. The keyword EXCEPTIONS (enclosed in parentheses) is optional and restricts the tabulation to those subgroups for which the control limits are exceeded or a test for special causes is positive.
- TABLETESTS <(EXCEPTIONS)>
-
augments the basic table created by the TABLES option with a column that indicates which of the tests for special causes (requested with the TESTS= option) are positive. The column contains the numbers of all the tests that are positive at a particular subgroup. The keyword EXCEPTIONS (enclosed in parentheses) is optional and restricts the tabulation to those subgroups for which the control limits are exceeded or a test for special causes is positive.
- TARGET=value-list
-
provides target values used to compute the capability index
 , which is saved in the OUTLIMITS= data set. If you provide more than one value, the number of values must match the number of processes listed in the chart statement. If you specify only one value, it is used for all the processes.
Caution: You can use the TARGET= options only in conjunction with the LSL= and USL= options. For more information, see Capability Indices and “Output Data Sets” in the section for the chart statement in which you are interested. Also see the entries for the LSL= and USL= options. The TARGET= option is available in the BOXCHART, IRCHART, MCHART, MRCHART, RCHART, SCHART, XCHART, XRCHART, and XSCHART statements.
-
TEST2RESET=variable
TEST2RESET=value -
enables tests for special causes to be reset in a secondary chart. The specified variable must be a character variable of length 8, or length 16 if customized tests are requested. The variable values have the same format as those of the
_TESTS_variable in a TABLE= data set. A test that is flagged by the TEST2RESET= value for a given subgroup is reset starting with that subgroup. That means a positive result for the test can include the given subgroup only if it is the first subgroup in the pattern. For example, the value “12345678” for the TEST2RESET= variable will reset all standard tests for special causes. - TEST2RUN=run-length
-
specifies the length of the pattern for Test 2 requested with the TESTS= and TESTS2= options. The values allowed for the run-length are 7, 8, 9, 11, 14, and 20. The form of the test for each run-length value is given in the following table. The default run-length is 9. See Tests for Special Causes: SHEWHART Procedure for more information.
Number of Points on One
Run-length
Side of the Central Line
7
7 in a row
8
8 in a row
9
9 in a row
11
at least 10 out of 11 in a row
14
at least 12 out of 14 in a row
20
at least 16 out of 20 in a row
- TEST3RUN=run-length
-
specifies the length of the pattern for Test 3 requested with the TESTS= and TESTS2= options. Test 3 searches for a pattern of steadily increasing or decreasing values, where the length of the pattern is at least the value given as the run-length. The values allowed for the run-length are 6, 7, and 8. The default run-length is 6. See Tests for Special Causes: SHEWHART Procedure for more information.
- TESTACROSS
-
specifies that tests for special causes requested with the TESTS= or TESTS2= options be applied without regard to phases (blocks of consecutive subgroups) determined by the READPHASES= option and the variable
_PHASE_in the input data set. With varying control limits, if you specify the READPHASES= option but do not specify the TESTACROSS option, tests for special causes are applied within (but not across) phases. With constant control limits, tests are applied across phases by default, and you can use the NOTESTACROSS option to specify that they be applied only within phases. See Tests for Special Causes: SHEWHART Procedure. - TESTCHAR='character'
-
Line Printerspecifies the character for the line segments that connect any sequence of points for which a test for special causes (requested with the TESTS= or TESTS2= option) is positive. The default character is the number of the test (with values 1 to 8).
-
TESTFONT=font
LABELFONT=font -
Traditional Graphicsspecifies a software font for labels requested with the ALLLABEL=, ALLLABEL2=, OUTLABEL=, OUTLABEL2=, STARLABEL=, TESTLABEL=, and TESTLABELn= options. Hardware characters are used by default.
-
TESTHEIGHT=value
LABELHEIGHT=value -
Traditional Graphicsspecifies the height (in vertical percent screen units) for labels requested with the ALLLABEL=, ALLLABEL2=, OUTLABEL=, OUTLABEL2=, STARLABEL=, TESTLABEL=, and TESTLABELn= options. The default height is the height specified with the HEIGHT= option or the HTEXT= option in the GOPTIONS statement.
- TESTLABBOX
-
Traditional GraphicsODS Graphicsrequests that labels for subgroups with positive tests for special causes are positioned so they do not overlap. The labels are enclosed in boxes that are connected to the associated subgroup points with line segments.
-
TESTLABEL='label'
TESTLABEL=(variable)
TESTLABEL=TESTINDEX
TESTLABEL=SPACE
TESTLABEL=NONE -
provides labels for points at which one of the tests for special causes (requested with the TESTS= or TESTS2= option) is positive. The values for the TESTLABEL= option are as follows:
-
You can specify a label of up to 16 characters enclosed in quotes. This label is displayed at all points where a test is signaled.
-
You can specify a variable (enclosed in parentheses) whose values are used as labels. The variable must be provided in the input data set, and it can be numeric or character. If the variable is character, its length cannot exceed 16. For each subgroup of observations at which a test is signaled, the formatted value of the variable in the observations is used to label the point representing the subgroup. If you are reading a DATA= data set with multiple observations per subgroup, the values of the variable should be identical for observations within a subgroup.
-
You can specify TESTINDEX to label points with the single-digit index that requested the test in a TESTS= or TESTS2= list. If the test was requested with a customized pattern in a TESTS= or TESTS2= list, then points are labeled with the letter that you specified using the CODE= option.
-
You can specify SPACE to request a label of the form Test k. This is slightly more legible than the default label of the form Testk (a description of Testk follows).
-
You can specify NONE to suppress labeling.
If you do not use the TESTLABEL= option, the default label is of the form Testk, where k is the index of the test as requested with the TESTS= or TESTS2= options, or k is the CODE= character of the test as requested in a pattern specified with the TESTS= or TESTS2= options.
See Tests for Special Causes: SHEWHART Procedure. Related options include OUTLABEL=, OUTLABEL2=, TESTFONT=, TESTHEIGHT=, and TESTLABELn=.
-
- TESTLABELn='label'
-
specifies a label for points at which the test for special causes requested with the index n in a TESTS= or TESTS2= list is positive. The index n can be a number from 1 to 8. The TESTLABELn= option overrides a TESTLABEL= option and the default label Test n. The label that you specify with the TESTLABELn= option can be up to 16 characters and must be enclosed in quotes.
See Tests for Special Causes: SHEWHART Procedure. Related options are TESTFONT=, TESTHEIGHT=, and TESTLABEL=.
- TESTNMETHOD=STANDARDIZE
-
applies the tests for special causes requested with the TESTS= and TESTS2= options to standardized test statistics when the subgroup sample sizes are not constant. This method was suggested by Nelson (1994). See Tests for Special Causes: SHEWHART Procedure. By default, the tests are not applied to data with varying subgroup sample sizes.
- TESTOVERLAP
-
applies tests for special causes (requested with the TESTS= or TESTS2= option) to overlapping patterns of points.
The TESTOVERLAP option modifies the way in which the search for a subsequent pattern is done when a pattern is encountered. If you omit the TESTOVERLAP option, the search begins with the first subgroup after the current pattern ends. If you specify the TESTOVERLAP option, the search begins with the second subgroup in the current pattern.
The following statements illustrate the use of the TESTOVERLAP option:
proc shewhart;
   xrchart Width*Hour / test=3;
   xrchart Width*Hour / test=3 testoverlap;
run;
Test 3 looks for six subgroup means in a row steadily increasing or decreasing. Suppose that the subgroup means of WIDTH are steadily increasing for HOUR=5, 6, 7, 8, 9, 10, and 11. The first XRCHART statement will signal that Test 3 is positive at HOUR=10 but not at HOUR=11, since the search for the next pattern begins with HOUR=11. The second XRCHART statement will signal that Test 3 is positive at HOUR=10 and HOUR=11, since the search for the next pattern begins with HOUR=6 and thus finds a second pattern ending with HOUR=11. See Tests for Special Causes: SHEWHART Procedure for more information.
Caution: Specifying TESTOVERLAP affects the interpretation of the standard tests for special causes, because a particular point can contribute to more than one positive test. Typically, this option should not be used.
-
TESTRESET=variable
TESTRESET=value -
enables tests for special causes to be reset in a primary chart. The specified variable must be a character variable of length 8, or length 16 if customized tests are requested. The variable values have the same format as those of the
_TESTS_variable in a TABLE= data set. A test that is flagged by the TESTRESET= value for a given subgroup is reset starting with that subgroup. That means that a positive result for the test can include the given subgroup only if it is the first subgroup in the pattern. For example, the value “12345678” for the TESTRESET= variable will reset all standard tests for special causes. -
TESTS=index-list
TESTS=customized-pattern-list -
requests one or more tests for special causes, which are also known as runs tests, pattern tests, and Western Electric rules. These tests detect particular nonrandom patterns in the points plotted on the primary control chart. The occurrence of a pattern, referred to as a signal, suggests the presence of a special cause of variation.
Each pattern is defined in terms of zones A, B, and C, which are constructed by dividing the interval between the control limits into six equally spaced subintervals. Zone A is the union of the subintervals immediately below the upper control limit and immediately above the lower control limit. Zone C is the union of the subintervals immediately above and below the central line. Zone B is the union of the subintervals between zones A and C. See Figure 17.177 for an illustration of test zones.
You can use the TESTS= option in three ways. First, you can specify an index-list to request a combination of standard tests (this is the approach most commonly used). Second, you can specify a customized-pattern-list to request a combination of tests based on customized patterns. Third, you can specify a list consisting of both indexes and customized-patterns. The first two approaches are described as follows.
Standard tests. The following table lists the standard tests that you can request by specifying TEST=index-list. The tests are indexed according to the sequence used by Nelson (1984, 1985).
Index
Pattern Description
1
one point beyond Zone A (outside the control limits)
2
nine points in a row in Zone C or beyond on one side of the central line (see the entry for the TEST2RUN option)
3
six points in a row steadily increasing (see the entry for the TEST3RUN option)
4
fourteen points in a row alternating up and down
5
two out of three points in a row in Zone A or beyond
6
four out of five points in a row in Zone B or beyond
7
fifteen points in a row in Zone C on either or both sides of the central line
8
eight points in a row on either or both sides of the central line with no points in Zone C
You can specify any combination of the eight indexes with an explicit list or with an implicit list, as in the following example:
proc shewhart;
   xrchart Width*Hour / tests=1 2 3 4;
   xrchart Width*Hour / tests=1 to 4;
run;
The TESTS= option is available in all but the RCHART and SCHART statements. Use only tests 1, 2, 3, and 4 in the CCHART, NPCHART, PCHART, and UCHART statements. By default, the TESTS= option is not applied in any chart statement unless the control limits are
limits. You can use the NO3SIGMACHECK option to request tests for special causes when you use the SIGMAS= option to specify
control limits other than limits.
Customized tests. Although the standard tests supported by the TESTS= option are appropriate for the vast majority of control chart applications, there may be situations in which you want to work with customized tests. You can define your own tests by specifying TESTS=customized-pattern-list. There are two types of patterns that you can include in this list: T-patterns and M-patterns.
Use a T-pattern to request a search for k out of m points in a row in the interval
 . The required syntax for a T-pattern is
T(K=k M=m LOWER=a UPPER=b CODE=character LABEL=’label’)
The default value for SCHEME= is ONESIDED. The options for a T-pattern are summarized in the following table:
Option
Description
K=k
number of points
M=m
number of consecutive points
LOWER=value
lower limit of interval
UPPER=value
upper limit of interval
SCHEME=ONESIDED
one-sided scheme using
SCHEME=TWOSIDED
two-sided scheme using


CODE=character
identifier for test (A-H)
LABEL=’label’
label for points if signal
LEGEND=’legend’
legend used with the TABLELEGEND option
Use an M-pattern to request a search for k points in a row increasing or decreasing. The required syntax for an M-pattern is
M(K=k DIR=direction CODE=character LABEL=’label’)
The options for an M-pattern are summarized in the following table:
Option
Description
K=k
number of points
DIR=INC
increasing pattern
DIR=DEC
decreasing pattern
CODE=character
identifier for test (A-H)
LABEL=’label’
label for points if signal
LEGEND=’legend’
legend used with the TABLELEGEND option
For details on the TESTS= option, see Tests for Special Causes: SHEWHART Procedure. Related options include CTEST=, CZONES=, LTEST=, TABLETESTS, TABLELEGEND, TEST2RUN=, TEST3RUN=, TESTACROSS, TESTCHAR=, TESTLABEL=, TESTLABELn=, TESTNMETHOD=, TESTOVERLAP, TESTS2=, ZONES, ZONECHAR=, and ZONELABELS.
-
TESTS2=index-list
TESTS2=customized-pattern-list -
requests one or more tests for special causes for an R chart or s chart. The syntax for the TESTS2= option is identical to the syntax for the TESTS= option. The TESTS2= option is available in the MRCHART, RCHART, SCHART, XRCHART, and XSCHART statements. For details on the TESTS2= option, see Tests for Special Causes: SHEWHART Procedure. Related options include CTEST=, CZONES=, LTEST=, TABLETESTS, TABLELEGEND, TEST2RUN=, TEST3RUN=, TESTACROSS, TESTCHAR=, TESTLABEL=, TESTLABELn=, TESTNMETHOD=, TESTOVERLAP, TESTS=, ZONES2, ZONECHAR=, and ZONE2LABELS.
-
TESTSYMBOL=symbol
TESTSYM=symbol -
Traditional Graphicsspecifies the symbol for plotting subgroups with positive tests for special causes.
-
TESTSYMBOLHT=value
TESTSYMHT=value -
Traditional Graphicsspecifies the height of the symbol used to plot subgroups with positive tests for special causes.
- TOTPANELS=n
-
specifies the total number of panels to be used to display the chart. This option overrides the NPANEL= option.
- TRENDVAR=variable | (variable-list)
-
specifies a list of trend variables, one for each process listed in the chart statement. The TRENDVAR= option is available only in the BOXCHART, MCHART, and XCHART statements and only when your input data set is a DATA= or HISTORY= data set.
The values of the trend variables are subtracted from the values of the corresponding process variables (if you read a DATA= data set) or subgroup mean variables (if you read a HISTORY= data set). The chart is then created for the residuals (differences), and the trend values are plotted in a secondary chart. If you specify a single trend variable and two or more processes, the trend variable is used with each process.
The TRENDVAR= option does not apply if you are reading a TABLE= data set. In this case, the procedure produces a trend chart only if the variable
_TREND_is included in the TABLE= data set.For more details, see Displaying Trends in Process Data. Related options include NOTRENDCONNECT, SEPARATE, SPLIT=, WTREND=, and YPCT1=.
-
TURNALL
TURNOUT -
turns the labels produced by the ALLLABEL=, ALLLABEL2=, OUTLABEL= and OUTLABEL2= options so that they are strung out vertically. By default, labels are arranged horizontally.
-
TURNHLABELS
TURNHLABEL -
Traditional GraphicsLine Printerturns the major tick mark labels for the horizontal (subgroup) axis so that they are strung out vertically. By default, labels are arranged horizontally.
If you are producing traditional graphics with the NOGSTYLE option in effect, you should specify a font (with the FONT= option) in conjunction with the TURNHLABELS option. Otherwise, the labels may be displayed with a mixture of hardware and software fonts.
Note: Turning the labels vertically may leave insufficient room on the screen or page for a chart.
- TYPE=value
-
specifies the value of the
_TYPE_variable in the OUTLIMITS= data set, which in turn indicates whether certain parameter variables in this data set represent estimates or standard (known) values.If you are using a chart statement that creates a variables chart,
_TYPE_is a bookkeeping variable that indicates whether the values of the variables_MEAN_and_STDDEV_in the OUTLIMITS= data set are estimates or standard values of the process mean and standard deviation . The following table summarizes the values that you can specify:
Value
_MEAN__STDDEV_ESTIMATE
estimate
estimate
STDMU
standard
estimate
STDSIGMA
estimate
standard
STANDARD
standard
standard
The default value is ESTIMATE, unless you specify standard values for
or with the MU0= or SIGMA0= options.
For PCHART and NPCHART statements, the value you specify for the TYPE= option can be either ESTIMATE or STANDARD, indicating that the value of the variable
_P_in the OUTLIMITS= data set is an estimate or standard value of the proportion p of nonconforming items. The default value is ESTIMATE, unless you specify a standard value for p with the P0= option.For UCHART and CCHART statements, the value you specify for the TYPE= option can be either ESTIMATE or STANDARD, indicating that the value of the variable
_U_in the OUTLIMITS= data set is an estimate or standard value of the average number u of nonconformities per unit. The default value is ESTIMATE, unless you specify a standard value for u with the U0= option. - U0=value
-
specifies a known (standard) value
 for the average number u of nonconformities per unit produced by the process. By default, is estimated from the data. The U0= option is available only in the CCHART and UCHART statements.
Note: As an alternative to specifying the U0= option, you can read a predetermined value for
from the variable _U_in a LIMITS= data set. For details, see “Input Data Sets” in the section for the chart statement in which you are interested. - UCLLABEL='label'
-
specifies a label for the upper control limit in the primary chart. The label can be up to 16 characters. Enclose the label in quotes. The default label is of the form UCL=value if the control limit has a fixed value; otherwise, the default label is UCL. Related options are UCLLABEL2=, LCLLABEL=, and LCLLABEL2=.
- UCLLABEL2='label'
-
specifies a label for the upper control limit in the secondary chart. The label can be up to 16 characters. Enclose the label in quotes. The default label is of the form UCL=value if the control limit has a fixed value; otherwise, the default label is UCL. This option is available in the IRCHART, MRCHART, XRCHART, and XSCHART statements. Related options are LCLLABEL2=, LCLLABEL=, and UCLLABEL=.
- URL=variable
-
ODS Graphicsspecifies URLs as values of the specified character variable (or formatted values of a numeric variable). These URLs are associated with subgroup points on a primary control chart when ODS Graphics output is directed into HTML. The value of the URL= variable should be the same for each observation with a given value of the subgroup variable.
- URL2=variable
-
ODS Graphicsspecifies URLs as values of the specified character variable (or formatted values of a numeric variable). These URLs are associated with subgroup points on a secondary control chart when ODS Graphics output is directed into HTML. The value of the URL2= variable should be the same for each observation with a given value of the subgroup variable.
- USL=value-list
-
provides upper specification limits used to compute capability indices. If you provide more than one value, the number of values must match the number of processes listed in the chart statement. If you specify only one value, it is used for all the processes.
The SHEWHART procedure uses the specification limits to compute capability indices, and it saves the limits and indices in the OUTLIMITS= data set. For more information, see Capability Indices and “Output Data Sets” in the section for the chart statement in which you are interested. A related option is LSL=. The USL= option is available in the BOXCHART, IRCHART, MCHART, MRCHART, RCHART, SCHART, XCHART, XRCHART, and XSCHART statements.
-
USYMBOL='label'
USYMBOL=U | UBAR | UPM | UPM2 | U0 -
specifies a label for the central line in a u chart. You can use the option in the following ways:
-
You can specify a quoted label up to 16 characters.
-
You can specify one of the keywords listed in the following table. Each keyword requests a label of the form symbol=value, where symbol is the symbol given in the table, and value is the value of the central line. If the central line is not constant, only the symbol is displayed.
Symbol Used in
Keyword
Graphics
Line Printer Charts
U
U
U
UBAR

UPM

UPM2

U0

U0
The default keyword is UBAR. The USYMBOL= option is available only in the UCHART statement.
-
-
VAXIS=value-list
VAXIS=AXISn -
specifies major tick mark values for the vertical axis of a primary chart. The values must be listed in increasing order, must be evenly spaced, and must span the range of summary statistics and control limits displayed in the chart. You can specify the values with an explicit list or with an implicit list, as shown in the following example:
proc shewhart;
   xrchart Width*Hour / vaxis=0 2 4 6 8;
   xrchart Width*Hour / vaxis=0 to 8 by 2;
run;
If you are producing traditional graphics, you can also specify a previously defined AXIS statement with the VAXIS= option. Related options are HAXIS= and VAXIS2=.
-
VAXIS2=value-list
VAXIS2=AXISn -
specifies major tick mark values for the vertical axis of a secondary chart. The specifications and restrictions are the same as for the VAXIS= option. The VAXIS2= option is available in the IRCHART, MRCHART, XRCHART, and XSCHART statements and in the BOXCHART, MCHART, and XCHART statements with the TRENDVAR= option. Related options are HAXIS= and VAXIS=.
- VFORMAT=format
-
specifies a format to be used for displaying tick mark labels on the vertical axis of a primary chart.
- VFORMAT2=format
-
specifies a format to be used for displaying tick mark labels on the vertical axis of a secondary chart.
-
VMINOR=n
VM=n -
Traditional Graphicsspecifies the number of minor tick marks between each major tick mark on the vertical axis. No values are printed on the minor tick marks. By default, VMINOR=0.
- VOFFSET=value
-
Traditional GraphicsODS Graphicsspecifies the length of the offset at the ends of the vertical axis. For traditional graphics, the offset is specified in percent screen units. For ODS Graphics output, the offset is specified in pixels.
-
VREF=value-list
VREF=SAS-data-set -
draws reference lines perpendicular to the vertical axis on the primary chart. Reference line values can be expressed as simple values or as multiples of the standard error of the subgroup summary statistic. You can use this option in the following ways:
-
Specify the values for the lines with a VREF= list. Examples of the VREF= option follow:
vref=20
vref=20 40 80
vref=(2.5 sigma)
vref=20 (1.5 2.0 2.5 sigma) 80
Values expressed as multiples of
must be enclosed in parentheses with the SIGMA keyword.
-
Specify the values for the lines as the values of a numeric variable named
_REF_in a VREF= data set. Optionally, you can provide labels for the lines as values of a variable named_REFLAB_, which must be a character variable of length 16 or less. If you want distinct reference lines to be displayed in charts for different processes specified in the chart statement, you must include a character variable of length 32 or less named_VAR_, whose values are the processes. If you do not include the variable_VAR_, all of the lines are displayed in all of the charts. If you want to display reference lines whose values are multiples of, you must include a character variable named _TYPE_, whose values are “VALUES” or “SIGMAS.” The value of_TYPE_indicates whether the reference line value is expressed as a simple value or as a multiple of.
Each observation in the VREF= data set corresponds to a reference line. If BY variables are used in the input data set (DATA=, HISTORY=, or TABLE=), the same BY variable structure must be used in the VREF= data set unless you specify the NOBYREF option.
This option can be used to add warning limits to be displayed on a chart.
Related options are CVREF=, LVREF=, NOBYREF, VREFCHAR=, VREFLABELS=, and VREFLABPOS=.
-
-
VREF2=value-list
VREF2=SAS-data-set -
draws reference lines perpendicular to the vertical axis on the secondary chart. The conventions for specifying the VREF2= option are identical to those for specifying the VREF= option. Related options are CVREF=, LVREF=, NOBYREF, VREFCHAR=, VREF2LABELS=, and VREFLABPOS=. The VREF2= option is available in the IRCHART, MRCHART, XRCHART, and XSCHART statements and in the BOXCHART, MCHART, and XCHART statements with the TRENDVAR= option.
-
VREF2LABELS='label1' …'labeln'
VREF2LAB='label1' …'labeln' -
specifies labels for the reference lines requested by the VREF2= option. The number of labels must equal the number of lines. Enclose each label in quotes. Labels can be up to 16 characters. The VREF2LABELS= option is available in the IRCHART, MRCHART, XRCHART, and XSCHART statements and in the BOXCHART, MCHART, and XCHART statements with the TRENDVAR= option.
- VREFCHAR='character'
-
Line Printerspecifies the character used for reference lines requested by the VREF= and VREF2= options on line printer charts. The default is the hyphen (-).
- VREFLABELS='label1' …'labeln'
-
specifies labels for the reference lines requested by the VREF= option. The number of labels must equal the number of lines. Enclose each label in quotes. Labels can be up to 16 characters.
- VREFLABPOS=n
-
specifies the horizontal position of the VREFLABEL= and VREF2LABEL= labels, as described in the following table. By default, n = 1.
n
Label Position
1
left-justified in subplot area
2
right-justified in subplot area
3
left-justified in right margin
Figure 17.141 illustrates label positions for values of the VREFLABPOS= option when the VREF= and VREFLABELS= options are as follows:
vref       = 8 9 11
vreflabels = 'Eight' 'Nine' 'Eleven'
Figure 17.141: Positions for Reference Line Labels
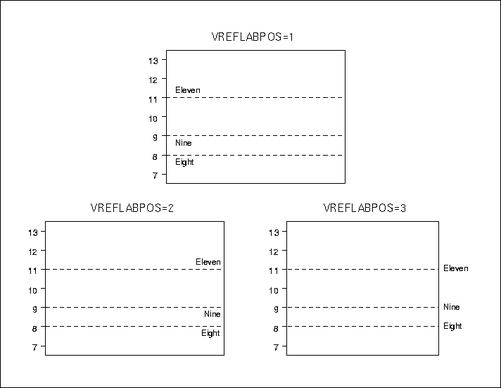
- VZERO
-
forces the origin to be included in the vertical axis for a primary chart.
- VZERO2
-
forces the origin to be included in the vertical axis for a secondary chart.
- WAXIS=n
-
Traditional Graphicsspecifies the width in pixels for the axis and frame lines. By default, n = 1.
- WBOXES=n
-
ODS Graphicsspecifies the width in pixels for the outlines of the box-and-whisker plots created with the BOXCHART statement in ODS Graphics output.
- WEBOUT=SAS-data-set
-
Traditional Graphicsproduces an output data set containing all the data in an OUTTABLE= data set plus graphics coordinates for points (subgroup summary statistics) that are displayed on a control chart. You can use an WEBOUT= data set to facilitate the development of web-based applications. See Interactive Control Charts: SHEWHART Procedure for details.
- WGRID=n
-
Traditional Graphicsspecifies the width in pixels for grid lines requested with the ENDGRID and GRID options. By default, n = 1.
- WLIMITS=n
-
Traditional Graphicsspecifies the width in pixels for the control limits and central line. By default, n = 1.
- WNEEDLES=n
-
Traditional Graphicsspecifies the width in pixels of needles connecting plotted points to the central line, as requested with the NEEDLES option. If you use the WNEEDLES= option, you do not need to specify the NEEDLES option. By default, n = 1.
- WOVERLAY=(value-list)
-
Traditional Graphicsspecifies the widths in pixels for the line segments connecting points on primary chart overlay plots. Widths in the WOVERLAY= list are matched with variables in the corresponding positions in the OVERLAY= list.
- WOVERLAY2=(value-list)
-
Traditional Graphicsspecifies the widths in pixels for the line segments connecting points on secondary chart overlay plots. Widths in the WOVERLAY2= list are matched with variables in the corresponding positions in the OVERLAY2= list.
- WSTARCIRCLES=n
-
Traditional Graphicsspecifies the width in pixels of the outline of circles requested by the STARCIRCLES= option. See Displaying Auxiliary Data with Stars. By default, n = 1.
- WSTARS=n
-
Traditional Graphicsspecifies the width in pixels of the outline of stars requested by the STARVERTICES= option. See Displaying Auxiliary Data with Stars. By default, n = 1.
-
WTESTS=n
WTEST=n -
Traditional Graphicsspecifies the width in pixels of the line segments that connect patterns of points for which a test for special causes (requested with the TESTS= or TESTS2= option) is positive. By default, n = 1.
- WTREND=n
-
Traditional Graphicsspecifies the width in pixels of the line segments that connect points on trend charts requested with the TRENDVAR= option. By default, n = 1. The WTREND= option is available in the BOXCHART, MCHART, and XCHART statements.
-
XSYMBOL='label'
XSYMBOL=keyword -
specifies a label for the central line in an
chart or a median chart. You can use the option in the following ways:
-
You can specify a quoted label up to 16 characters.
-
You can specify one of the keywords listed in the following table. Each keyword requests a label of the form symbol=value, where symbol is the symbol given in the table, and value is the value of the central line. If the central line is not constant, only the symbol is displayed.
Symbol Used in
Keyword
Graphics
Line Printer Charts
MBAR

MTIL

MU
MU
MU0
MU0
XBAR

XBAR2

XBARPM

XBAR0


XBAR0PM


For the IRCHART statement, the default keyword is XBAR. For the MCHART and MRCHART statements, the default keyword is MBAR. For all other chart statements, the default keyword is XBAR2. The XSYMBOL= option is available in the BOXCHART, IRCHART, MCHART, MRCHART, XCHART, XRCHART, and XSCHART statements.
-
- YPCT1=value
-
specifies a percent (ranging from 0 to 100) that determines the length of the vertical axis for the primary chart in proportion to the sum of the lengths of the vertical axes for the primary and secondary charts. For example, you can specify YPCT1=50 in an XRCHART statement to request that the vertical axes for the
and R charts have the same length. The default value is 60. The YPCT1= option is available in the IRCHART, MRCHART, XRCHART, and XSCHART statements and in the BOXCHART, MCHART,
and XCHART statements with the TRENDVAR= option.
- YSCALE=PERCENT
-
scales the vertical axis on a p chart in percent units. The YSCALE= option is available only in the PCHART statement.
-
ZEROSTD
ZEROSTD=NOLIMITS -
specifies that a control chart is to be constructed and displayed regardless of whether the estimated process standard deviation
 is zero. When is zero, the control limits are degenerate (collapsed around the central line), and the chart simply serves as a placeholder,
particularly when a series of charts is to be created. Specify ZEROSTD=NOLIMITS to suppress the display of the degenerate
limits. By default, a chart is not displayed when is zero.
is zero. When is zero, the control limits are degenerate (collapsed around the central line), and the chart simply serves as a placeholder,
particularly when a series of charts is to be created. Specify ZEROSTD=NOLIMITS to suppress the display of the degenerate
limits. By default, a chart is not displayed when is zero.
- ZONE2LABELS
-
adds the labels A, B, and C to zone lines requested with the ZONES2 or ZONE2VALUES options. The ZONE2LABELS option is available in the MRCHART, RCHART, SCHART, XRCHART, and XSCHART statements.
- ZONE2VALUES
-
labels R or s chart zones lines with their values. If the ZONE2VALUES option is specified the ZONES2 option is not required.
- ZONECHAR='character'
-
Line Printerspecifies the character used to form the zone lines requested by the ZONES option. See the entry for the TESTS= option for a description of the zones. You do not need to specify the ZONES option if you specify the ZONECHAR= option. By default, the line between Zone A and Zone B uses the character 'B', and the line between Zone B and Zone C uses the character 'C'. Related options are TESTS=, TESTS2=, ZONES, and ZONES2.
- ZONELABELS
-
adds the labels A, B, and C to zone lines requested with the ZONES or ZONEVALUES options. The ZONELABELS option is not available in the RCHART or SCHART statements.
- ZONES
-
adds lines to a primary chart that delineate zones A, B, and C for standard tests requested with the TESTS= option. Related options are CZONES= and ZONELABELS. The ZONES option is not available in the RCHART or SCHART statements.
- ZONES2
-
adds lines to an R or s chart that delineate zones A, B, and C for tests requested with the TESTS2= option. Related options are CZONES= and ZONE2LABELS. The ZONES2 option is available in the MRCHART, RCHART, SCHART, XRCHART, and XSCHART statements.
- ZONEVALPOS=n
-
specifies the horizontal position of the ZONEVALUES= and ZONE2VALUES= labels, as described in the following table. By default, n = 1.
n
Label Position
1
left-justified in subplot area
2
right-justified in subplot area
3
left-justified in right margin
- ZONEVALUES
-
labels the primary chart zones lines with their values. If the ZONEVALUES option is specified the ZONES option is not required.
[89] This is true for SAS 6.10 and later releases of SAS/QC software. For SAS 6.09 and earlier releases, the procedure calculates control limits from the data unless you specify a LIMITS= data set in the procedure statement and you specify either the READLIMITS option or the READINDEXES= option in the chart statement. The NOREADLIMITS option is not available for SAS 6.09 and earlier releases. For more information, see the entry for the READLIMITS option.
[90] For details about computing control limits from the data, see the entry for the NOREADLIMITS option.