Formatting Values and Customizing Labels
By default, each inset statistic is identified with an appropriate label, and each numeric value is printed using an appropriate
format. However, you may want to provide your own labels and formats. For example, in Figure 17.121 the default format used for ![]() and the process standard deviation prints an excessive number of decimal places. The following statements produce
and the process standard deviation prints an excessive number of decimal places. The following statements produce ![]() and R charts, each with its own inset. The unwanted decimal places are eliminated and the default specification limits labels are
replaced with abbreviations:
and R charts, each with its own inset. The unwanted decimal places are eliminated and the default specification limits labels are
replaced with abbreviations:
ods graphics on;
title 'Mean Chart for Diameters';
proc shewhart data=Wafers;
   xrchart Diameter*Batch /
      lsl      = 34.97
      usl      = 35.03
      odstitle = title;
   inset lsl='LSL' usl='USL' / pos = nw;
   inset2 cp (6.4) stddev (6.4) / pos = nw;
run;
ods graphics off;
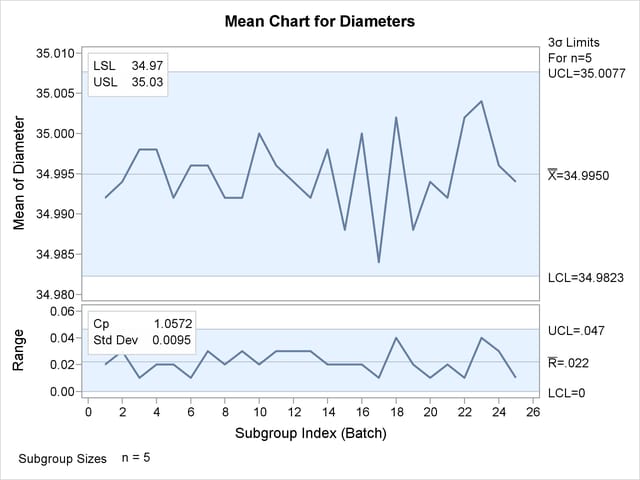
The ODS GRAPHICS ON statement specified before the PROC SHEWHART statement enables ODS Graphics, so the ![]() and R charts are created using ODS Graphics instead of traditional graphics. The resulting charts are displayed in Figure 17.122.
and R charts are created using ODS Graphics instead of traditional graphics. The resulting charts are displayed in Figure 17.122.
You can provide your own label by specifying the keyword for that statistic followed by an equal sign (=) and the label in quotes. The label can have up to 24 characters.
The format 6.4 specified in parentheses after the CP and STDDEV keywords displays those statistics with a field width of six and four decimal places. In general, you can specify any numeric SAS format in parentheses after an inset keyword. You can also specify a format to be used for all the statistics in the INSET statement with the FORMAT= option. For more information about SAS formats, refer to SAS Formats and Informats: Reference.
Note that if you specify both a label and a format for a statistic, the label must appear before the format.
Figure 17.122: Formatting Values and Customizing Labels in an Inset