RCHART Statement: SHEWHART Procedure

Creating Range Charts from Raw Data
See SHWRCHR in the SAS/QC Sample LibraryA disk drive manufacturer performs a battery of tests to evaluate its drives. The following statements create a data set named
Disks, which contains the time (in milliseconds) required to complete one of these tests for six drives in each of 25 lots:
data Disks;
   input Lot @;
   do i=1 to 6;
      input Time @;
      output;
   end;
   drop i;
   datalines;
  1 8.05 7.90 8.04 8.06 8.01 7.99
  2 8.03 8.06 8.02 8.02 7.97 8.03
  3 8.00 7.94 7.97 7.95 8.00 8.01
  4 8.00 8.06 8.06 7.99 7.97 7.96
  5 7.93 8.01 8.00 8.09 8.06 8.02
  6 7.98 7.99 8.01 8.09 8.00 7.97
  7 8.00 7.94 7.93 8.03 7.93 8.08
  8 8.01 7.98 7.98 8.07 8.05 8.09
  9 7.97 7.96 8.01 8.11 8.06 8.07
 10 7.93 8.03 8.03 8.00 7.93 8.03
 11 8.00 8.00 8.02 7.92 7.98 8.01
 12 7.98 7.93 8.01 7.97 8.02 8.00
 13 8.06 7.93 7.98 7.98 8.02 7.96
 14 8.05 7.98 8.05 7.99 7.95 7.99
 15 7.94 8.01 7.97 8.04 7.91 8.03
 16 8.03 8.03 8.02 8.06 8.00 7.97
 17 8.03 7.94 8.05 8.05 8.04 7.94
 18 7.99 7.99 7.86 7.99 8.06 8.03
 19 7.95 7.96 7.99 7.96 7.94 8.12
 20 8.03 8.07 7.98 7.97 8.00 8.04
 21 8.04 7.90 8.03 8.02 7.98 7.97
 22 7.95 8.05 7.98 8.01 7.97 8.15
 23 8.06 8.00 8.03 8.02 7.99 7.95
 24 7.97 8.02 8.00 7.96 7.96 8.00
 25 8.12 7.97 7.99 8.09 8.05 8.00
;
A partial listing of Disks is shown in Figure 17.69.
Figure 17.69: Partial Listing of the Data Set Disks
| The Data Set DISKS |
| Lot | Time |
|---|---|
| 1 | 8.05 |
| 1 | 7.90 |
| 1 | 8.04 |
| 1 | 8.06 |
| 1 | 8.01 |
| 1 | 7.99 |
| 2 | 8.03 |
| 2 | 8.06 |
| 2 | 8.02 |
| 2 | 8.02 |
| 2 | 7.97 |
| 2 | 8.03 |
| 3 | 8.00 |
| 3 | 7.94 |
| 3 | 7.97 |
| 3 | 7.95 |
| 3 | 8.00 |
| 3 | 8.01 |
The data set Disks is said to be in “strung-out” form since each observation contains the lot number and test time for a single disk drive. The first five observations contain
the times for the first lot, the second five observations contain the times for the second lot, and so on. Because the variable
Lot classifies the observations into rational subgroups, it is referred to as the subgroup-variable. The variable Time contains the time measurements and is referred to as the process variable (or process for short).
You can use an R chart to determine whether the variability in the performance of the disk drives is in control. The following statements create the R chart shown in Figure 17.70:
ods graphics off;
title 'Range Chart for Disk Drive Test Times';
proc shewhart data=Disks;
   rchart Time*Lot;
run;
This example illustrates the basic form of the RCHART statement. After the keyword RCHART, you specify the process to analyze (in this case, Time), followed by an asterisk and the subgroup-variable (Lot).
The input data set is specified with the DATA= option in the PROC SHEWHART statement.
Figure 17.70: R Chart for the Data Set Disks (Traditional Graphics)
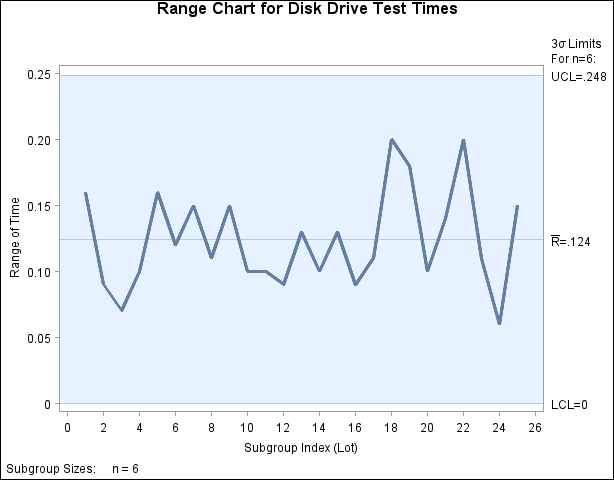
Each point on the R chart represents the range of the measurements for a particular lot. For instance, the range plotted for the first lot is
![]() . Since all of the subgroup ranges lie within the control limits, you can conclude that the variability in the performance
of the disk drives is in statistical control.
. Since all of the subgroup ranges lie within the control limits, you can conclude that the variability in the performance
of the disk drives is in statistical control.
By default, the control limits shown are ![]() limits estimated from the data; the formulas for the limits are given in Table 17.48. You can also read control limits from an input data set; see Reading Preestablished Control Limits.
limits estimated from the data; the formulas for the limits are given in Table 17.48. You can also read control limits from an input data set; see Reading Preestablished Control Limits.
For computational details, see Constructing Range Charts. For more details on reading raw data, see DATA= Data Set.