NPCHART Statement: SHEWHART Procedure

Constructing Charts for Number Nonconforming (np Charts)
The following notation is used in this section:
|
p |
expected proportion of nonconforming items produced by the process |
|
|
|
proportion of nonconforming items in the ith subgroup |
|
|
|
number of nonconforming items in the ith subgroup |
|
|
|
number of items in the ith subgroup |
|
|
|
average proportion of nonconforming items taken across subgroups:
|
|
|
N |
number of subgroups |
|
|
|
incomplete beta function:
for |
Plotted Points
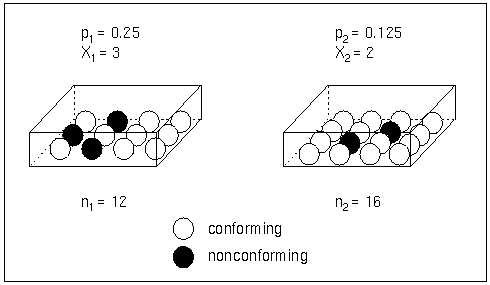
Each point on an ![]() chart represents the observed number (
chart represents the observed number (![]() ) of nonconforming items in a subgroup. For example, suppose the first subgroup (see Figure 17.58) contains 12 items, of which three are nonconforming. The point plotted for the first subgroup is
) of nonconforming items in a subgroup. For example, suppose the first subgroup (see Figure 17.58) contains 12 items, of which three are nonconforming. The point plotted for the first subgroup is ![]() .
.
Figure 17.58: Proportions Versus Counts
Note that a p chart displays the proportion of nonconforming items ![]() . You can use the PCHART statement to create p charts; see PCHART Statement: SHEWHART Procedure.
. You can use the PCHART statement to create p charts; see PCHART Statement: SHEWHART Procedure.
Central Line
By default, the central line on an ![]() chart indicates an estimate for
chart indicates an estimate for ![]() , which is computed as
, which is computed as ![]() . If you specify a known value (
. If you specify a known value (![]() ) for p, the central line indicates the value of
) for p, the central line indicates the value of ![]() . Note that the central line varies with
. Note that the central line varies with ![]() .
.
Control Limits
You can compute the limits in the following ways:
-
as a specified multiple (k) of the standard error of
 above and below the central line. The default limits are computed with k = 3 (these are referred to as
  limits).
-
as probability limits defined in terms of
 , a specified probability that exceeds the limits
The lower and upper control limits, LCL and UCL respectively, are computed as
|
|
|
|
A lower probability limit for ![]() can be determined using the fact that
can be determined using the fact that
![\[ \begin{array}{ll} P\{ X_ i < \mbox{LCL}\} & = 1 - P\{ X_ i \geq \mbox{LCL}\} \\ & = 1 - I_{\bar{p}}(\mbox{LCL},n_ i+1-\mbox{LCL}) \\ & = I_{1- \bar{p}}(n_ i+1-\mbox{LCL},\mbox{LCL}) \\ \end{array} \]](images/qcug_shewhart0204.png) |
Refer to Johnson, Kotz, and Kemp (1992). This assumes that the process is in statistical control and that ![]() is binomially distributed. The lower probability limit LCL is then calculated by setting
is binomially distributed. The lower probability limit LCL is then calculated by setting
|
|
and solving for LCL. Similarly, the upper probability limit for ![]() can be determined using the fact that
can be determined using the fact that
|
|
The upper probability limit UCL is then calculated by setting
|
|
and solving for UCL. The probability limits are asymmetric about the central line. Note that both the control limits and
probability limits vary with ![]() .
.
You can specify parameters for the limits as follows:
-
Specify k with the SIGMAS= option or with the variable
_SIGMAS_in a LIMITS= data set. -
Specify
with the ALPHA= option or with the variable _ALPHA_in a LIMITS= data set. -
Specify a constant nominal sample size
 for the control limits with the LIMITN= option or with the variable
 _LIMITN_in a LIMITS= data set. -
Specify
 with the P0= option or with the variable
 _P_in the LIMITS= data set.