MCHART Statement: SHEWHART Procedure

Creating Charts for Medians from Subgroup Summary Data
See SHWMCHR in the SAS/QC Sample LibraryThe previous example illustrates how you can create median charts using raw data (process measurements). However, in many applications the data are provided as subgroup summary statistics. This example illustrates how you can use the MCHART statement with data of this type.
The following data set (Detsum) provides the data from the preceding example in summarized form. There is exactly one observation for each subgroup (note
that the subgroups are still indexed by Lot). The variable WeightM contains the subgroup medians, the variable WeightR contains the subgroup ranges, and the variable WeightN contains the subgroup sample sizes (these are all five).
data Detsum;
   input Lot WeightM WeightR;
   WeightN = 5;
   datalines;
 1  22.56  9.54
 2  23.54  3.07
 3  24.35  4.65
 4  25.52  5.05
 5  23.25  8.04
 6  23.01  6.33
 7  24.19  2.19
 8  26.27  2.18
 9  22.31  6.08
10  22.66  8.21
11  26.38  4.97
12  23.01  5.05
13  23.15  5.37
14  24.73  4.95
15  25.86  5.58
16  23.99  4.35
17  24.30  5.24
18  24.88  4.87
19  25.92  7.22
20  25.63  6.30
21  25.17  6.52
22  26.72  5.18
23  23.67  9.17
24  24.92  4.62
25  24.51  5.40
26  24.75  3.41
27  25.10  4.76
28  25.64  3.47
;
A partial listing of Detsum is shown in Figure 17.35.
Figure 17.35: The Summary Data Set Detsum
| Summary Data Set for Detergent Box Weights |
| Lot | WeightM | WeightR | WeightN |
|---|---|---|---|
| 1 | 22.56 | 9.54 | 5 |
| 2 | 23.54 | 3.07 | 5 |
| 3 | 24.35 | 4.65 | 5 |
| 4 | 25.52 | 5.05 | 5 |
| 5 | 23.25 | 8.04 | 5 |
| 6 | 23.01 | 6.33 | 5 |
| 7 | 24.19 | 2.19 | 5 |
| 8 | 26.27 | 2.18 | 5 |
| 9 | 22.31 | 6.08 | 5 |
| 10 | 22.66 | 8.21 | 5 |
| 11 | 26.38 | 4.97 | 5 |
| 12 | 23.01 | 5.05 | 5 |
| 13 | 23.15 | 5.37 | 5 |
| 14 | 24.73 | 4.95 | 5 |
| 15 | 25.86 | 5.58 | 5 |
| 16 | 23.99 | 4.35 | 5 |
| 17 | 24.30 | 5.24 | 5 |
| 18 | 24.88 | 4.87 | 5 |
| 19 | 25.92 | 7.22 | 5 |
| 20 | 25.63 | 6.30 | 5 |
| 21 | 25.17 | 6.52 | 5 |
| 22 | 26.72 | 5.18 | 5 |
| 23 | 23.67 | 9.17 | 5 |
| 24 | 24.92 | 4.62 | 5 |
| 25 | 24.51 | 5.40 | 5 |
| 26 | 24.75 | 3.41 | 5 |
| 27 | 25.10 | 4.76 | 5 |
| 28 | 25.64 | 3.47 | 5 |
You can read this data set by specifying it as a HISTORY= data set in the PROC SHEWHART statement, as follows:
options nogstyle;
goptions ftext=swiss;
title 'Median Chart for Weights';
proc shewhart history=Detsum;
   mchart Weight*Lot / cframe  = viv
                       cinfill = vpav
                       cconnect = yellow;
run;
options gstyle;
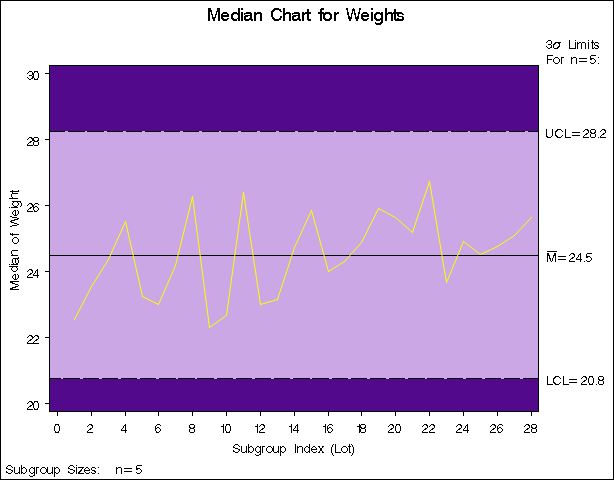
The NOGSTYLE system option causes ODS styles not to affect traditional graphics. Instead, the MCHART statement options control the appearance of the graph. The GSTYLE system option restores the use of ODS styles for traditional graphics produced subsequently. The resulting median chart is shown in Figure 17.36.
Note that Weight is not the name of a SAS variable in the data set Detsum but is, instead, the common prefix for the names of the three SAS variables WeightM, WeightR, and WeightN. The suffix characters M, R, and N indicate median, range, and sample size, respectively. Thus, you can specify three subgroup summary variables in the HISTORY= data set with a single name (Weight), which is referred to as the process. The name Lot specified after the asterisk is the name of the subgroup-variable.
Figure 17.36: Median Chart from Summary Data Set Detsum (Traditional Graphics with NOGSTYLE)
In general, a HISTORY= input data set used with the MCHART statement must contain the following variables:
-
subgroup variable
-
subgroup median variable
-
either a subgroup range variable or a subgroup standard deviation variable
-
subgroup sample size variable
Furthermore, the names of the subgroup median, range (or standard deviation), and sample size variables must begin with the process name specified in the MCHART statement and end with the special suffix characters M, R (or S), and N, respectively. If the names do not follow this convention, you can use the RENAME option in the PROC SHEWHART statement to rename the variables for the duration of the SHEWHART procedure step (see Creating Charts for Medians and Ranges from Summary Data).
If you specify the STDDEVIATIONS option in the MCHART statement, the HISTORY= data set must contain a subgroup standard deviation
variable; otherwise, the HISTORY= data set must contain a subgroup range variable. The STDDEVIATIONS option specifies that
the estimate of the process standard deviation ![]() is to be calculated from subgroup standard deviations rather than subgroup ranges. For example, in the following statements,
the data set
is to be calculated from subgroup standard deviations rather than subgroup ranges. For example, in the following statements,
the data set Detsum2 must contain a subgroup standard deviation variable named WeightS:
title 'Median Chart for Weights';
symbol v=dot;
proc shewhart history=Detsum2;
   mchart Weight*Lot / stddeviations;
run;
Options such as STDDEVIATIONS are specified after the slash (/) in the MCHART statement. A complete list of options is presented in the section Syntax: MCHART Statement.
In summary, the interpretation of process depends on the input data set.
-
If raw data are read using the DATA= option (as in the previous example), process is the name of the SAS variable containing the process measurements.
-
If summary data are read using the HISTORY= option (as in this example), process is the common prefix for the names of the variables containing the summary statistics.
For more information, see HISTORY= Data Set.