Customizing Tests with DATA Step Programs
[See SHWTSC5 in the SAS/QC Sample Library]Occasionally, you may find it necessary to apply customized tests that cannot be specified with the TESTS= option. You can program your own tests as follows:
Run the SHEWHART procedure without the TESTS= option and save the results in an OUTTABLE= data set. Use the NOCHART option to suppress the display of the chart.
Use a DATA step program to apply your tests to the subgroup statistics in the OUTTABLE= data set. If tests are signaled at certain subgroups, save these results as values of a flag variable named _TESTS_, which should be a character variable of length 8. Recall that each observation of an OUTTABLE= data set corresponds to a subgroup. Assign the character i to the
 th character of _TESTS_ if the th customized test is signaled at that subgroup (otherwise, assign a blank character).
 Run the procedure reading the modified data set as a TABLE= data set.
The following example illustrates these steps by creating an  chart for the data in Assembly (see Requesting Standard Tests) that signals a special cause of variation if an average is greater than 2.5 standard errors above the central line. The first step is to compute
  limits and save both the subgroup statistics and the limits in an OUTTABLE= data set named First.
proc shewhart history=Assembly;
   xchart Offset * Sample /
      sigmas   = 2.5
      outtable = First
      nochart ;
run;
title ;
proc print data=First(obs=10) noobs;
run;
A partial listing of the data set First is shown in Figure 15.190.
| _VAR_ | Sample | _SIGMAS_ | _LIMITN_ | _SUBN_ | _LCLX_ | _SUBX_ | _MEAN_ | _UCLX_ | _STDDEV_ | _EXLIM_ |
|---|---|---|---|---|---|---|---|---|---|---|
| Offset | 1 | 2.5 | 5 | 5 | 18.1515 | 19.80 | 20.4733 | 22.7951 | 2.07665 | |
| Offset | 2 | 2.5 | 5 | 5 | 18.1515 | 17.16 | 20.4733 | 22.7951 | 2.07665 | LOWER |
| Offset | 3 | 2.5 | 5 | 5 | 18.1515 | 20.11 | 20.4733 | 22.7951 | 2.07665 | |
| Offset | 4 | 2.5 | 5 | 5 | 18.1515 | 20.89 | 20.4733 | 22.7951 | 2.07665 | |
| Offset | 5 | 2.5 | 5 | 5 | 18.1515 | 20.83 | 20.4733 | 22.7951 | 2.07665 | |
| Offset | 6 | 2.5 | 5 | 5 | 18.1515 | 18.87 | 20.4733 | 22.7951 | 2.07665 | |
| Offset | 7 | 2.5 | 5 | 5 | 18.1515 | 20.84 | 20.4733 | 22.7951 | 2.07665 | |
| Offset | 8 | 2.5 | 5 | 5 | 18.1515 | 23.33 | 20.4733 | 22.7951 | 2.07665 | UPPER |
| Offset | 9 | 2.5 | 5 | 5 | 18.1515 | 19.21 | 20.4733 | 22.7951 | 2.07665 | |
| Offset | 10 | 2.5 | 5 | 5 | 18.1515 | 20.48 | 20.4733 | 22.7951 | 2.07665 |
The second step is to carry out the test and create the flag variable _TESTS_.
data First;
   set First;
   length _tests_ $ 8;
   if _subx_ > _uclx_ then substr( _tests_, 1 ) = '1';
run;
Finally, the data set First is read by the SHEWHART procedure as a TABLE= data set.
ods graphics off;
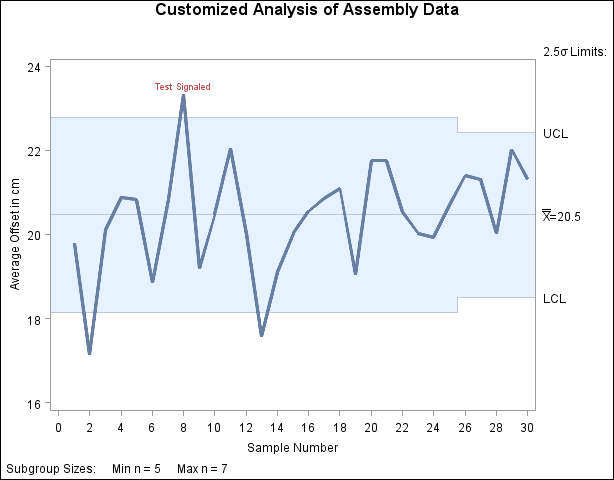
title 'Customized Analysis of Assembly Data';
proc shewhart table=First;
xchart Offset * Sample / tests = 1
testlabel1 = 'Test Signaled';
label _subx_ = 'Average Offset in cm';
run;
The chart is shown in Figure 15.191. Note that the variable _TESTS_ is read "as is" to flag points on the chart, and the standard tests are not applied to the data. The option TESTS=1 specifies that a point is to be labeled if the first character of _TESTS_ for the corresponding subgroup is 1. The label is specified by the TESTLABEL1= option (the default would be Test1).
In general, you can simultaneously apply up to eight customized tests with the variable _TESTS_, which is of length 8. If two or more tests are signaled at a particular point, the label that is displayed corresponds to the test that appears first in the TESTS= list. In the preceding example, the test involves only the current subgroup. For customized tests involving patterns that span multiple subgroups, you will find it helpful to use the LAG functions described in SAS Functions and CALL Routines: Reference.
Notes:
If you provide the variable _TESTS_ in a TABLE= data set, you must also use the TESTS= option to specify which characters of _TESTS_ are to be checked.
The CTESTS= and LTESTS= options specify colors and line styles for standard patterns and may not be applicable with customized tests.