Applying Tests to Range and Standard Deviation Charts
[See SHWTSC3 in the SAS/QC Sample Library]If you are using the MRCHART, RCHART, SCHART, XRCHART, or XSCHART statement, you can use the TESTS2= option to request tests for special causes with an  chart or
  chart. The syntax and test definitions for the TESTS2= option are identical to those for the TESTS= option, and you can use the ZONES2 and ZONE2LABELS options to display the zones on the secondary chart.
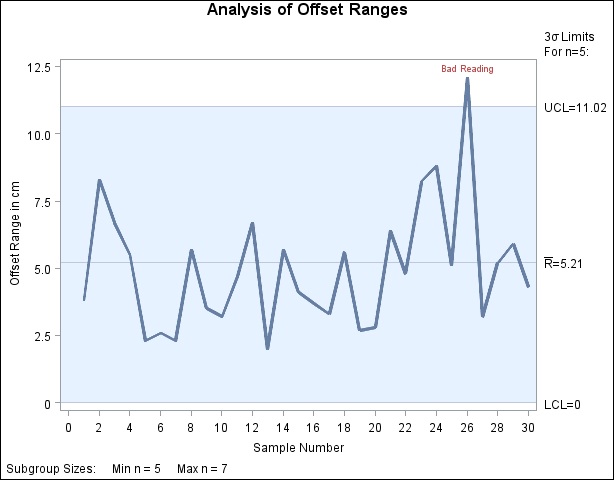
The following statements request Test 1 for a range chart of the data in Assembly (see Requesting Standard Tests):
ods graphics off;
title 'Analysis of Offset Ranges';
proc shewhart history=Assembly;
   rchart Offset * Sample / sigma0    = 2.24
                            limitn    = 5
                            alln
                            tests2    = 1
                            testlabel = (comment) ;
   label OffsetR = 'Offset Range in cm';
run;
The chart is shown in Figure 15.188.
Caution: Except for requesting Test 1, use of the TESTS2= option is not recommended for general process control work. At the time of this writing, there is insufficient published research supporting the application of the other tests to charts and charts. There are no established guidelines for interpreting the other tests, nor are there assessments of their false signal probabilities or average run length characteristics. The TESTS2= option is intended primarily as a research tool.