XCHART Statement: SHEWHART Procedure

Example 15.35 Estimating the Process Standard Deviation
[See SHWXEX2 in the SAS/QC Sample Library]The following data set (Wire) contains breaking strength measurements recorded in pounds per inch for 25 samples from a metal wire manufacturing process. The subgroup sample sizes vary between 3 and 7.
data Wire;
   input Sample size @;
   do i=1 to size;
      input Breakstrength @@;
      output;
      end;
   drop i size;
   label Breakstrength  ='Breaking Strength (lb/in)'
         Sample ='Sample Index';
   datalines;
 1  5 60.6 62.3 62.0 60.4 59.9
 2  5 61.9 62.1 60.6 58.9 65.3
 3  4 57.8 60.5 60.1 57.7
 4  5 56.8 62.5 60.1 62.9 58.9
 5  5 63.0 60.7 57.2 61.0 53.5
 6  7 58.7 60.1 59.7 60.1 59.1 57.3 60.9
 7  5 59.3 61.7 59.1 58.1 60.3
 8  5 61.3 58.5 57.8 61.0 58.6
 9  6 59.5 58.3 57.5 59.4 61.5 59.6
10  5 61.7 60.7 57.2 56.5 61.5
11  3 63.9 61.6 60.9
12  5 58.7 61.4 62.4 57.3 60.5
13  5 56.8 58.5 55.7 63.0 62.7
14  5 62.1 60.6 62.1 58.7 58.3
15  5 59.1 60.4 60.4 59.0 64.1
16  5 59.9 58.8 59.2 63.0 64.9
17  6 58.8 62.4 59.4 57.1 61.2 58.6
18  5 60.3 58.7 60.5 58.6 56.2
19  5 59.2 59.8 59.7 59.3 60.0
20  5 62.3 56.0 57.0 61.8 58.8
21  4 60.5 62.0 61.4 57.7
22  4 59.3 62.4 60.4 60.0
23  5 62.4 61.3 60.5 57.7 60.2
24  5 61.2 55.5 60.2 60.4 62.4
25  5 59.0 66.1 57.7 58.5 58.9
;
The following statements request an  chart, shown in Output 15.35.1, for the breaking strength measurements:
ods graphics off;
title 'Mean Chart for Breaking Strengths';
proc shewhart data=Wire;
   xchart Breakstrength*Sample;
run;
Chart with Varying Subgroup Sample Sizes
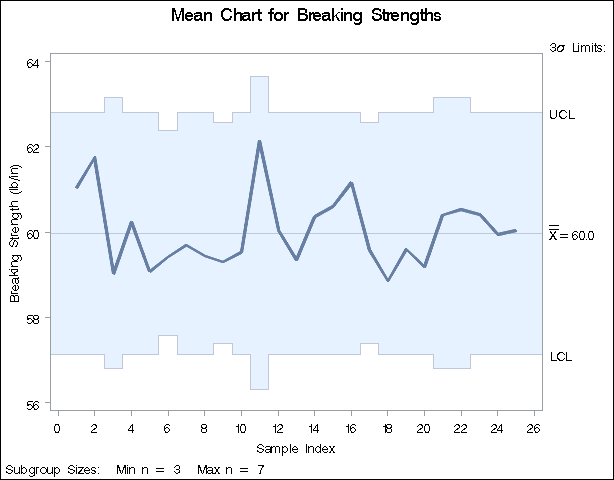
Note that the control limits vary with the subgroup sample size. The sample size legend in the lower left corner displays the minimum and maximum subgroup sample sizes.
By default, the control limits are  limits estimated from the data. You can use the STDDEVIATIONS option and the SMETHOD= option to specify how the estimate of the process standard deviation
  is to be computed, as illustrated by the following statements:
proc shewhart data=Wire;
   xchart Breakstrength*Sample / outlimits=Wirelim1
                         outindex ='Default-Ranges'
                         nochart;
   xchart Breakstrength*Sample / outlimits=Wirelim2
                         stddeviations
                         outindex ='Default-Stds'
                         nochart;
   xchart Breakstrength*Sample / outlimits=Wirelim3
                         smethod  =mvlue
                         outindex ='MVLUE  -Ranges'
                         nochart;
   xchart Breakstrength*Sample / outlimits=Wirelim4
                         stddeviations
                         smethod  =mvlue
                         outindex ='MVLUE  -Stds'
                         nochart;
   xchart Breakstrength*Sample / outlimits=Wirelim5
                         stddeviations
                         smethod  =rmsdf
                         outindex ='RMSDF  -Stds'
                         nochart;
run;
The STDDEVIATIONS option specifies that the estimate is to be calculated from subgroup standard deviations rather than subgroup ranges, the default. The SMETHOD= option specifies the method for estimating . The default method estimates as an unweighted average of subgroup estimates of . Specifying SMETHOD=MVLUE requests a minimum variance linear unbiased estimate, and specifying SMETHOD=RMSDF requests a weighted root-mean-square estimate. For details, see Methods for Estimating the Standard Deviation.
The variable _STDDEV_ in each OUTLIMITS= data set contains the estimate of . The OUTINDEX= option specifies the value of the variable _INDEX_ in the OUTLIMITS= data set and is used here to identify the estimation method.
The following statements merge the five OUTLIMITS= data sets into a single data set, which is listed in Output 15.35.2:
data wlimits;
   set Wirelim1 Wirelim2 Wirelim3 Wirelim4 Wirelim5;
   keep _index_ _stddev_;
run;
| Estimates of the Process Standard Deviation |
| _INDEX_ | _STDDEV_ |
|---|---|
| Default-Ranges | 2.11146 |
| Default-Stds | 2.15453 |
| MVLUE -Ranges | 2.11240 |
| MVLUE -Stds | 2.14790 |
| RMSDF -Stds | 2.17479 |
The chart shown in Output 15.35.1 uses the default estimate listed first in Output 15.35.2 ( ). In this case, there is very little difference in the five estimates, since the sample sizes do not differ greatly. In general, the MVLUE’s are recommended with large sample sizes (
 ).
).