MRCHART Statement: SHEWHART Procedure

Example 15.16 Working with Unequal Subgroup Sample Sizes
[See SHWMR2 in the SAS/QC Sample Library]A brewery monitors its bottling process to ensure that each bottle is filled with the proper amount of beer. The following data set contains the amount of beer recorded in fluid ounces for 23 batches:
data Beer;
   input Batch size @;
   do i=1 to size;
      input Amount @@;
      output;
      end;
   drop i size;
   label Batch  ='Batch Number';
   datalines;
 1  5  12.01 11.97 11.93 11.98 12.00
 2  5  11.88 11.98 11.93 12.03 11.92
 3  5  11.93 11.99 12.00 12.03 11.95
 4  5  11.98 11.94 12.02 11.90 11.97
 5  5  12.02 12.02 11.98 12.04 11.90
 6  4  11.98 11.98 12.00 11.93
 7  5  11.93 11.95 12.02 11.91 12.03
 8  5  12.00 11.98 12.02 11.89 12.01
 9  5  11.98 11.93 11.99 12.02 11.91
10  5  11.97 12.02 12.05 12.01 11.97
11  5  12.02 12.01 11.97 12.02 11.94
12  5  11.93 11.83 11.99 12.02 12.01
13  5  12.01 11.98 11.94 12.04 12.01
14  5  11.98 11.96 12.02 12.00 12.00
15  5  11.97 11.99 12.03 11.95 11.96
16  5  11.99 11.95 11.96 12.03 12.01
17  4  11.99 11.97 12.03 12.01
18  5  11.94 11.96 11.98 12.03 11.97
19  5  11.97 11.87 11.90 12.01 11.95
20  5  11.96 11.94 11.96 11.98 12.05
21  3  12.06 12.07 11.98
22  5  12.01 11.98 11.96 11.97 12.00
23  5  12.00 12.02 12.03 11.99 11.96
;
A batch is regarded as a rational subgroup. Five bottles of beer are supposed to be tested in each batch. However, in batch 6 and batch 17 only four bottles are tested, and in batch 21 only three bottles are tested. The following statements request median and range charts, shown in Output 15.16.1, for the beer amounts:
ods graphics on;
title 'Median and Range Charts for Beer Amount';
proc shewhart data=Beer;
   mrchart Amount*Batch / odstitle=title;
run;
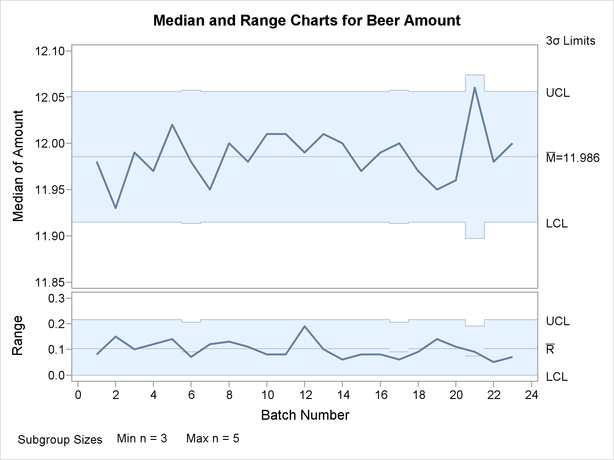
Since none of the subgroup medians or subgroup ranges fall outside their respective control limits, you can conclude that the process is in control.
Note that the central line on the range chart and the control limits on both charts vary with the subgroup sample size. The subgroup sample size legend displays the minimum and maximum subgroup sample sizes.
The SHEWHART procedure provides various options for working with unequal subgroup sample sizes. For example, you can use the LIMITN= option to specify a fixed (nominal) sample size for the control limits, as illustrated by the following statements:
title 'Median and Range Charts for Beer Amount';
proc shewhart data=Beer;
   mrchart Amount*Batch / limitn=5 odstitle=title;
run;
The resulting charts are shown in Output 15.16.2.
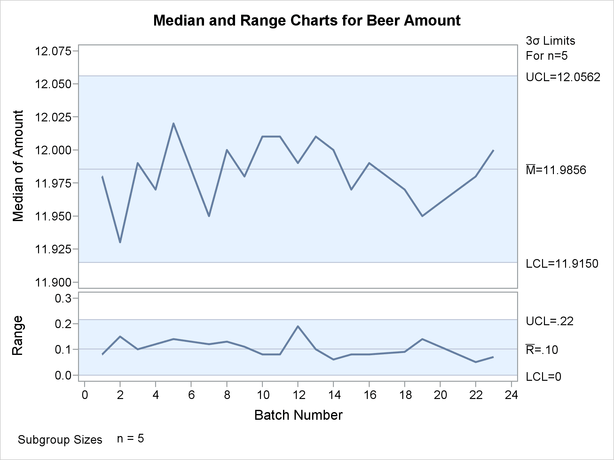
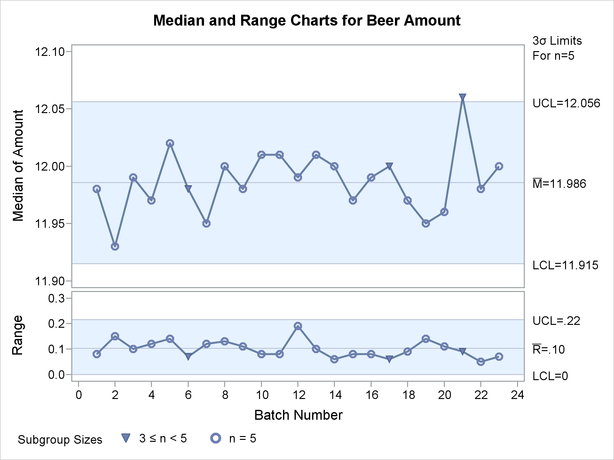
Note that the points displayed on the chart are those corresponding to subgroups whose sample size matches the nominal sample size (five) specified with the LIMITN= option. Points are not plotted for batches 6, 17, and 21. To display points for all subgroups (regardless of subgroup sample size), specify the ALLN option. The following statements produce the charts shown in Output 15.16.3:
title 'Median and Range Charts for Beer Amount';
proc shewhart data=Beer;
   mrchart Amount*Batch / limitn   = 5
                          odstitle = title
                          alln
                          nmarkers;
run;
The NMARKERS option requests special symbols that identify points for which the subgroup sample size differs from the nominal sample size. In Output 15.16.3, the median amount for batch 21 exceeds the upper control limits, indicating that the process is not in control. This illustrates the approximate nature of fixed control limits used with subgroup samples of varying sizes.
You can use the SMETHOD= option to determine how the process standard deviation  is to be estimated when the subgroup sample sizes vary. The default method computes as an unweighted average of subgroup estimates of . The MVLUE method assigns greater weight to estimates of from subgroups with larger sample sizes. If the subgroup sample sizes are constant, the MVLUE method reduces to the NOWEIGHT method.
For details, see Methods for Estimating the Standard Deviation. The following statements estimate using both methods:
proc shewhart data=Beer;
   mrchart Amount*Batch / outindex  = 'Default'
                          outlimits = Blim1
                          nochart;
   mrchart Amount*Batch / smethod   = mvlue
                          outindex  = 'MVLUE'
                          outlimits = Blim2
                          nochart;
run;

data Blimits;
   set Blim1 Blim2;
run;
The estimates are saved as values of the variable _STDDEV_ in the data set Blimits, which is listed in Output 15.16.4. The bookkeeping variable _INDEX_ identifies the estimate.
| The Data Set Blimits |
| _VAR_ | _SUBGRP_ | _INDEX_ | _TYPE_ | _LIMITN_ | _ALPHA_ | _SIGMAS_ | _LCLM_ | _MEAN_ | _UCLM_ | _LCLR_ | _R_ | _UCLR_ | _STDDEV_ |
|---|---|---|---|---|---|---|---|---|---|---|---|---|---|
| Amount | Batch | Default | ESTIMATE | V | V | 3 | V | 11.9856 | V | V | V | V | 0.043938 |
| Amount | Batch | MVLUE | ESTIMATE | V | V | 3 | V | 11.9856 | V | V | V | V | 0.044004 |
In the data set Blimits, the variables _LIMITN_, _ALPHA_, _LCLM_, _UCLM_, _LCLR_, _R_, and _UCLR_ have been assigned the special missing value V. This indicates that the quantities represented by these variables vary with the subgroup sample size.