CCHART Statement: SHEWHART Procedure

Example 15.10 Creating c Charts for Varying Numbers of Units
[See SHWCEX3 in the SAS/QC Sample Library]In applications where the number of inspection units per subgroup is not equal to one, a  chart is typically used to analyze the number of nonconformities per unit (see UCHART Statement: SHEWHART Procedure). However, as shown in this example, you can use the CCHART statement to create a
  chart for this type of data.
Charts and Charts
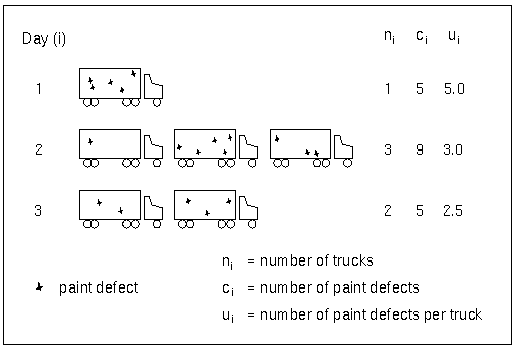
Figure 15.25 illustrates a situation in which varying numbers of trucks are painted each day. Trucks painted on the same day are regarded as subgroups, and each truck is regarded as an inspection unit. The following statements create a SAS data set named Trucks4, which contains paint defects for trucks painted on 26 days:
data Trucks4;
   input Day Defects Ntrucks @@;
   label Day='Day'
         Defects='Number of Paint Defects';
   datalines;
 1   5  1    2   9  3
 3   5  2    4   9  2
 5  24  4    6  10  2
 7  15  3    8  17  3
 9  16  3   10  13  2
11  28  4   12  18  5
13   8  2   14   7  2
15   5  1   16  17  3
17   2  1   18  17  3
19  15  4   20  19  5
21   6  3   22  23  5
23  27  4   24   6  2
25  12  2   26  12  3
;
The variable Defects provides the defect count ( ) for the
  th day, and the variable Ntrucks provides the number of inspection units (
 ). The following statements create a chart for this data:
ods graphics off;
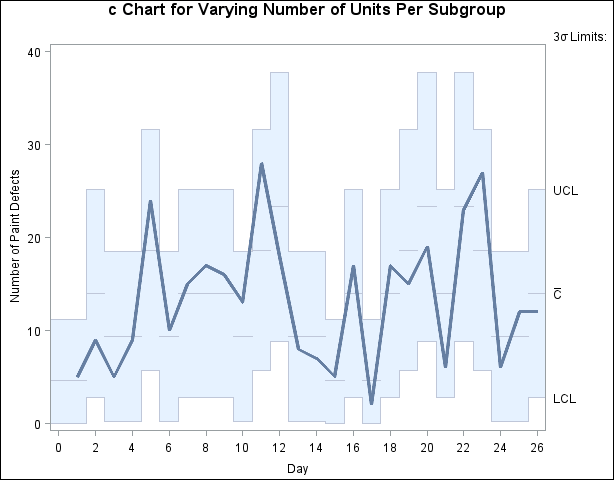
title 'c Chart for Varying Number of Units Per Subgroup';
proc shewhart data=Trucks4;
cchart Defects*Day / subgroupn = Ntrucks
nolegend;
run;
The SUBGROUPN= option specifies the subgroup sample size variable Ntrucks (in general, the values of this variable need not be integers). Alternatively, you can specify a fixed value with the SUBGROUPN= option. When this option is not specified, it is assumed that  .
.
The chart is shown in Output 15.26. Note that the central line and the control limits vary with the number of inspection units.
Chart for Varying Number of Units