BOXCHART Statement: SHEWHART Procedure
- Overview
-
Getting Started

-
Syntax
-
Details
-
Examples
Using Box Charts to Compare Subgroups Creating Various Styles of Box-and-Whisker Plots Creating Notched Box-and-Whisker Plots Creating Box-and-Whisker Plots with Varying Widths Creating Box-and-Whisker Plots with Different Line Styles and Colors Computing the Control Limits for Subgroup Maximums Constructing Multi-Vari Charts
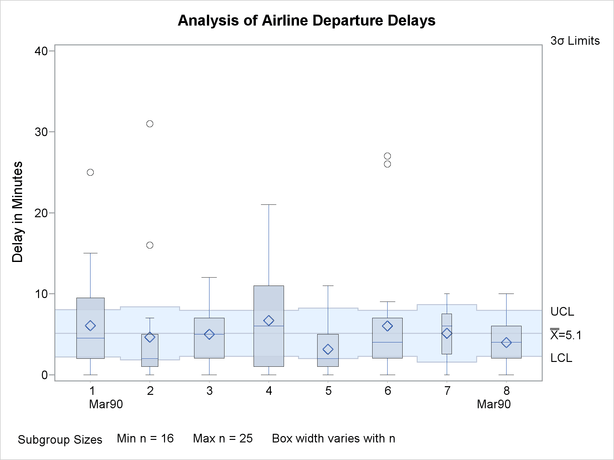
Example 15.4 Creating Box-and-Whisker Plots with Varying Widths
[See SHWBOX7 in the SAS/QC Sample Library]This example shows how to create a box chart with box-and-whisker plots whose widths vary proportionately with the subgroup sample size. The following statements create a SAS data set named Times2 that contains flight departure delays (in minutes) recorded daily for eight consecutive days:
data Times2;
   label Delay = 'Delay in Minutes';
   informat Day date7. ;
   format   Day date7. ;
   input Day @ ;
   do Flight=1 to 25;
      input Delay @ ;
      output;
      end;
datalines;
01MAR90   12  4   2   2  15   8   0  11   0   0
          0  12   3   .   2   3   5   0   6  25
          7   4   9   5  10
02MAR90   1   .   3   .   0   1   5   0   .   .
          1   5   7   .   7   2   2  16   2   1
          3   1  31   .   0
03MAR90   6   8   4   2   3   2   7   6  11   3
          2   7   0   1  10   2   5  12   8   6
          2   7   2   4   5
04MAR90  12   6   9   0  15   7   1   1   0   2
          5   6   5  14   7  21   8   1  14   3
         11   0   1  11   7
05MAR90   2   1   0   4   .   6   2   2   1   4
          1  11   .   1   0   .   5   5   .   2
          3   6   6   4   0
06MAR90   8   6   5   2   9   7   4   2   5   1
          2   2   4   2   5   1   3   9   7   8
          1   0   4  26  27
07MAR90   9   6   6   2   7   8   .   .  10   8
          0   2   4   3   .   .   .   7   .   6
          4   0   .   .   .
08MAR90   1   6   6   2   8   8   5   3   5   0
          8   2   4   2   5   1   6   4   5  10
          2   0   4   1   1
;
The following statements create the box chart shown in Output 15.4.1:
title 'Analysis of Airline Departure Delays';
proc shewhart data=Times2;
   boxchart Delay * Day /
      nohlabel
      boxstyle      = schematic
      odstitle      = title
      boxwidthscale = 1 ;
run;
The BOXWIDTHSCALE=1 option specifies that the widths of the box-and-whisker plots are to vary proportionately to the subgroup sample size  . This option is useful in situations where the sample size varies widely across subgroups. For further details, see the entry for BOXWIDTHSCALE= in Dictionary of Options: SHEWHART Procedure.
Output 15.4.1
Box Chart with Box-and-Whisker Plots of Varying Widths