Example 10.3 Comparison of Univariate and Multivariate Control Charts for Correlated Data
This example shows how a multivariate control chart captures changes in the correlation between a process measurement variable while univariate control charts do not. The following statements draw  observations from the multivariate normal distribution with specified mean
  and covariance
  . The observations are savide in a data set named mvpStable.
proc iml;
   Mean = {0,0};
   Cor = {1.00 0.75,
          0.75 1.00};
   StdDevs = {2 2};
   D = diag(StdDevs);
   Cov = D*Cor*D; /* covariance matrix */
   NumSamples = 30;
   call randseed(123321);  /* set seed for the RandNormal module */
   X = RandNormal(NumSamples, Mean, Cov);
   varnames = { x1 x2 };
   create mvpStable from X [colname = varnames];
   append from X;
   quit;
run;
data mvpStable;
   set mvpStable;
   hour=_n_;
run;
To demonstrate the effect of a change in correlation on univariate and multivariate control charts, five new observations are generated. The following statements generate data from a bivariate normal distribution with a correlation coefficient of  , which has the same mean and marginal variances as before.
proc iml;
   Mean = {0,0};
   Cor = {1.00 -0.75,
         -0.75  1.00};
   StdDevs = {2 2};
   D = diag(StdDevs);
   Cov = D*Cor*D; /* covariance matrix */
   NumSamples = 5;
   call randseed(123321);  /* set seed for the RandNormal module */
   X = RandNormal(NumSamples, Mean, Cov);
   varnames = { x1 x2 };
   create mvpOOC from X [colname = varnames];
   append from X;
   quit;
run;
The following statements produce a data set named mvpOOC, which contains the 30 observations from the distribution with  , and the five observations from the distribution with .
data mvpOOC;
   set mvpStable mvpOOC;
   hour=_n_;
run;
The following statements build a two-component model with the MVPMODEL procedure using the mvpStable data set:
proc mvpmodel data=mvpStable ncomp=2 plots=none outloadings=loadings
   timegroup= hour;
   var x1 x2;
run;
The  chart is produced by the MVPMONITOR procedure using the mvpOOC data set:
proc mvpmonitor data=mvpOOC loadings=loadings;
   time hour;
   tsquarechart;
run;
These statements produce a chart, shown in Output 10.3.1.
Chart
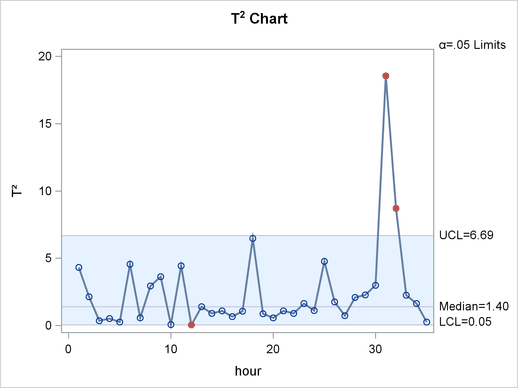
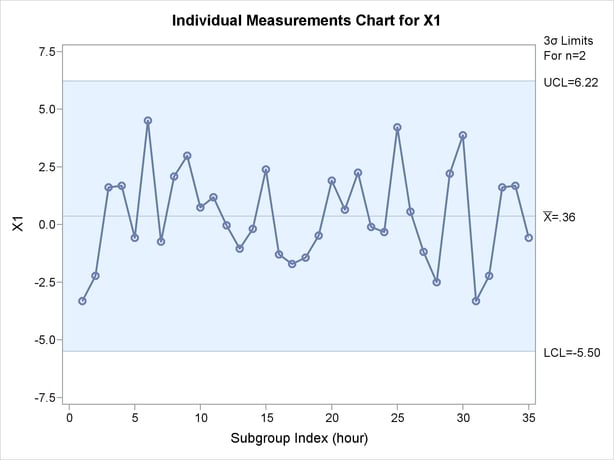
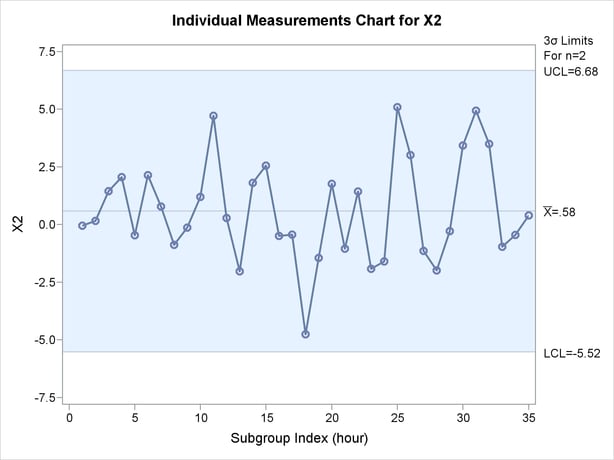
The last five points are from an out-of-control distribution resulting in some out-of-control points in the
chart, while there are no out-of-control points in the univariate control charts shown in Output 10.3.2 and Output 10.3.3. These charts are produced with the following statements. proc shewhart data=mvpOOC; irchart (x1 x2) * hour / nochart2 markers; run;


Note: This procedure is experimental.