| The SHEWHART Procedure |
Example 13.28 Specifying Control Limit Information
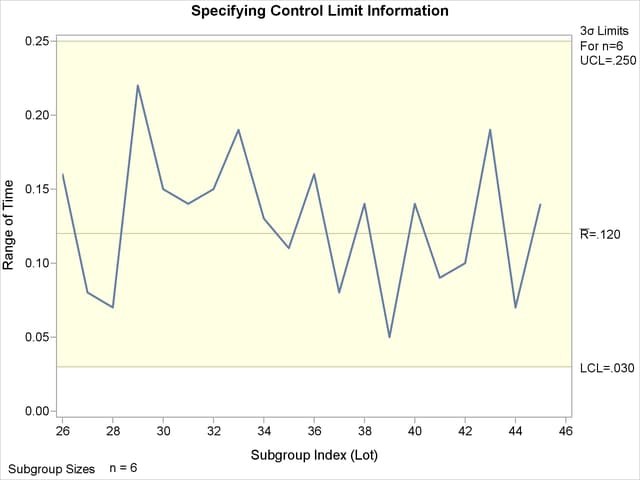
[See SHWREX2 in the SAS/QC Sample Library]This example illustrates how you can use a DATA step program to create a LIMITS= data set. You can provide previously established values for the limits and central line with the variables _LCLR_, _R_, and _UCLR_, as in the following statements:
data Dlimits2;
   length _var_ _subgrp_ _type_ $8;
   _var_    = 'Time';
   _subgrp_ = 'Lot';
   _type_   = 'STANDARD';
   _limitn_ = 6;
   _lclr_   = .03;
   _r_      = .12;
   _uclr_   = .25;
run;
The following statements1 apply the control limits in Dlimits2 to the measurements in DISKS2 (see Reading Preestablished Control Limits) and create the  chart shown in Output 13.28.1:
ods graphics on;
title 'Specifying Control Limit Information';
proc shewhart data=Disks2 limits=Dlimits2;
   rchart Time*Lot / odstitle=title;
run;
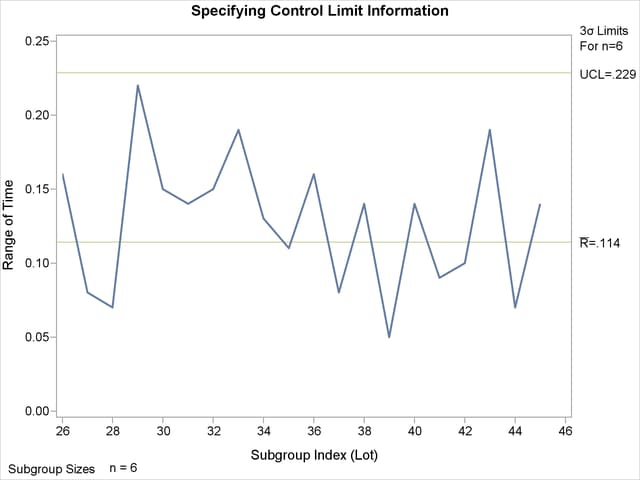
In some cases, a standard value ( ) may be available for the process standard deviation. The following DATA step creates a data set named Dlimits3 that provides this value:
data Dlimits3;
   length _var_ _subgrp_ _type_ $8;
   _var_    = 'Time';
   _subgrp_ = 'Lot';
   _stddev_ = .045;
   _limitn_ = 6;
   _type_   = 'STDSIGMA';
run;
The variable _TYPE_ is a bookkeeping variable whose value indicates that the value of _STDDEV_ is a standard value rather than an estimate.
The following statements read the value of from Dlimits3 and create the chart shown in Output 13.28.2:
title 'Specifying Control Limit Information';
proc shewhart data=Disks2 limits=Dlimits3;
   rchart Time*Lot / nolimit0 odstitle=title;
run;
ods graphics off;
The NOLIMIT0 option suppresses the display of a fixed lower control limit if the value of the limit is zero (which is the case in this example).
Instead of specifying with the variable _STDDEV_ in a LIMITS= data set, you can use the SIGMA0= option in the RCHART statement. The following statements create an chart identical to the chart shown in Output 13.28.2:
proc shewhart data=Disks;
   rchart Time*Lot / sigma0=.045 nolimit0;
run;
For more information, see LIMITS= Data Set.
Footnotes
Copyright © SAS Institute, Inc. All Rights Reserved.