| The SHEWHART Procedure |
Example 13.27 Computing Probability Limits
[See SHWREX1 in the SAS/QC Sample Library]This example demonstrates how to create  charts with probability limits. The following statements read the disk drive test times from the data set Disks (see Creating Range Charts from Raw Data) and create the chart shown in Output 13.27.1:
title 'Probability Limits for Disk Drive Test Times';
proc shewhart data=Disks;
   rchart Time*Lot / alpha     = .01
                     outlimits = Dlimits;
run;
The ALPHA= option specifies the probability ( ) that a subgroup range exceeds its limits. Here, the limits are computed so that the probability that a range is less than the lower limit is
  , and the probability that a range is greater than the upper limit is . This assumes that the measurements are normally distributed. The OUTLIMITS= option names an output data set that saves the probability limits. A listing of Dlimits is shown in Output 13.27.2.
The variable _ALPHA_ saves the value of . Note that, in this case, the upper probability limit is equivalent to an upper  limit.
Chart with Probability Limits
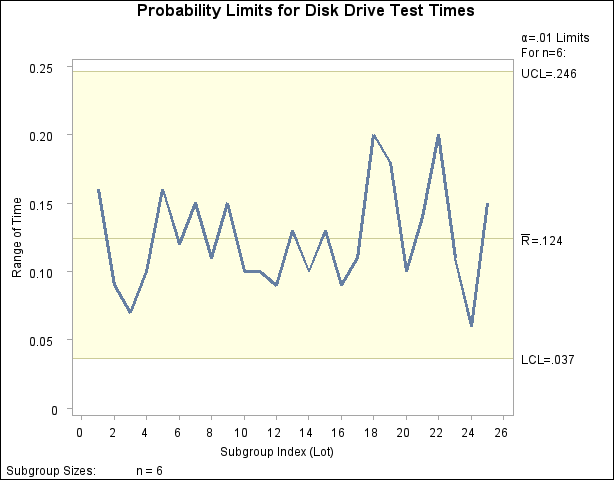
Since all the points fall within the probability limits, it can be concluded that the variability in the disk drive performance is in statistical control.
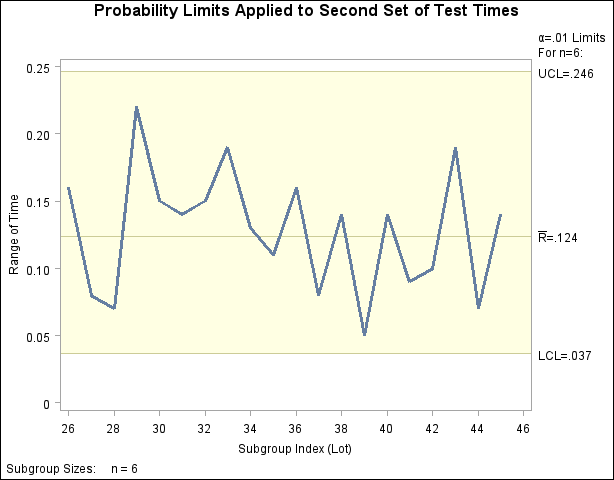
The following statements apply the limits in Dlimits to the times in the data set DISKS2 (see Reading Preestablished Control Limits):
title 'Probability Limits Applied to Second Set of Test Times';
proc shewhart data=Disks2 limits=Dlimits;
   rchart Time*Lot / readalpha;
run;
The READALPHA option1 specifies that the variable _ALPHA_, rather than the variable _SIGMAS_, is to be read from the LIMITS= data set. Thus the limits displayed in the chart, shown in Output 13.27.3, are probability limits.
Footnotes
Copyright © SAS Institute, Inc. All Rights Reserved.