| The SHEWHART Procedure |
Creating Individual Measurements and Moving Range Charts
[See SHWIR1 in the SAS/QC Sample Library]An aeronautics company manufacturing jet engines measures the inner diameter of the forward face of each engine (in centimeters). The following statements create a SAS data set that contains the diameter measurements for 20 engines:
data Jets;
   input Engine Diam @@;
   label Engine = "Engine Number";
datalines;
 1 78.4   2 80.1   3 84.4   4 79.1   5 80.4
 6 83.5   7 73.8   8 83.5   9 75.0  10 76.8
11 70.5  12 80.3  13 82.4  14 79.4  15 86.4
16 90.5  17 77.7  18 82.5  19 79.9  20 83.2
;
run;
A partial listing of Jets is shown in Figure 13.10.3.
Each observation contains the diameter measurement and identification number for a particular engine. The variable Engine identifies the sequence of engines and is referred to as the subgroup-variable.1 The variable Diam contains the measurements and is referred to as the process variable (or process for short).
Since the production rate is low, individual measurements and moving range charts are used to monitor the process. The following statements create the charts shown in Figure 13.10.4:
title 'Individual Measurements and Moving Range Charts';
title2 'Jet Engine Diameters (cm)';
proc shewhart data=Jets;
   irchart Diam*Engine;
run;
This example illustrates the basic form of the IRCHART statement. After the keyword IRCHART, you specify the process to analyze (in this case, Diam), followed by an asterisk and the subgroup-variable (Engine).
The input data set is specified with the DATA= option in the PROC SHEWHART statement.
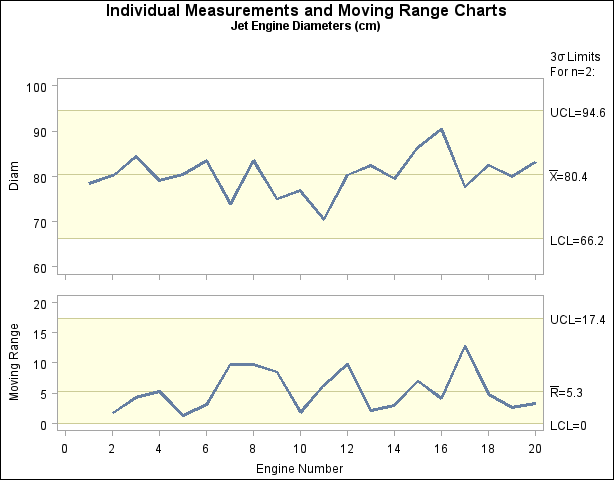
Each point on the individual measurements chart indicates the inner diameter of a particular engine. Each point on the moving range chart indicates the range of the two most recent measurements. For instance, the moving range plotted for the second engine is  . No moving range is plotted for the first engine. Since all of the individual measurements and moving ranges lie within the control limits, it can be concluded that the process is in statistical control.
By default, the control limits shown are  limits estimated from the data; the formulas for the limits are given in section Table. You can also read control limits from an input data set; see Reading Preestablished Control Limits.
Copyright © SAS Institute, Inc. All Rights Reserved.