| The SHEWHART Procedure |
Example 13.9 Specifying a Known Expected Number of Nonconformities
[See SHWCEX2 in the SAS/QC Sample Library]This example illustrates how you can create a  chart based on a known (standard) value
  for the expected number of nonconformities per unit.
A chart is used to monitor the number of paint defects per truck. The defect counts are provided as values of the variable Defects in the data set Trucks given in Creating c Charts from Defect Count Data. Based on previous testing, it is known that  . The following statements create a chart with control limits derived from this value:
symbol v = dot;
title 'c Chart for Paint Defects on New Trucks';
title2 'Usng Data in TRUCKS and Standard Value UO=7';
proc shewhart data=Trucks;
   cchart Defects*TruckID / u0       = 7
                            csymbol  = c0
                            nolegend
                            nolimitslegend
                            nolimit0;
run;
The chart is shown in Output 13.9.1. The U0= option specifies , and the CSYMBOL= option requests a label for the central line indicating that the line represents a standard value. The NOLEGEND option suppresses the legend for the subgroup sample size, and the NOLIMITSLEGEND option suppresses the legend for the control limits that appears by default in the upper right corner of the chart. The NOLIMIT0 option suppresses the display of the lower limit when it is equal to zero.
Chart with Standard Value 
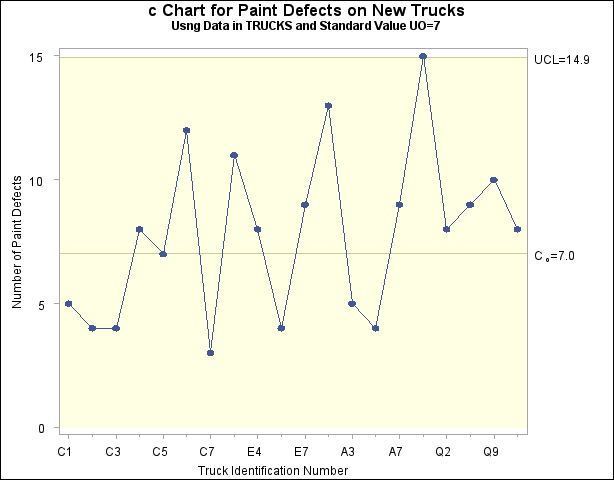
The number of paint defects on Truck Q1 exceeds the upper control limit, indicating that the process is out of control.
Alternatively, you can specify as the value of the variable _U_ in a LIMITS= data set, as follows:
data tlimits;
   length _subgrp_ _var_ _type_ $8;
   _U_      = 7;
   _subgrp_ = 'truckid';
   _var_    = 'defects';
   _limitn_ = 1;
   _type_   = 'STANDARD';

proc shewhart data=trucks limits=tlimits;
   cchart defects*truckid / csymbol=c0
                            nolegend
                            nolimitslegend
                            nolimit0;
run;
The chart produced by these statements is identical to the one in Output 13.9.1.
For further details, see LIMITS= Data Set.
Copyright © SAS Institute, Inc. All Rights Reserved.