| The SHEWHART Procedure |
Example 13.7 Constructing Multi-Vari Charts
"Multi-vari" charts1 are used in a variety of industries to analyze process data with nested (hierarchical) patterns of variation
within-sample variation (for example, position within wafer)
sample-to-sample variation within batches of samples (for example, wafer within lot)
batch-to-batch variation (for example, across lots)
This example illustrates the construction of a "multi-vari" display. The following statements create a SAS data set named Parm that contains the value of a measured parameter (Measure) recorded at each of five positions on wafers produced in lots.
data Parm;
   length _phase_ $ 5 Wafer $ 2 position $ 1;
   input  _phase_ $  &  Wafer $ &  position $  Measure ;
   datalines;
   Lot A      01         L        2.42435
   Lot A      01         B        2.44150
   Lot A      01         C        2.42143
   Lot A      01         T        2.44960
   Lot A      01         R        2.50050
   Lot A      02         L        2.68188
   Lot A      02         B        2.57195
   Lot A      02         C        2.54678
   Lot A      02         T        2.65978
   Lot A      02         R        2.69208
   Lot A      03         L        2.18005
   Lot A      03         B        2.13593
   Lot A      03         C        2.44303
   Lot A      03         T        2.29052
   Lot A      03         R        2.25963
   Lot B      01         L        2.46573
   Lot B      01         B        2.44898

   ... more lines ...

   Lot G      03         C        2.66303
   Lot G      03         T        2.65913
   Lot G      03         R        2.84378
run;
The following statements create an ordinary side-by-side box-and-whisker display for the measurements.
title 'Box-and-Whisker Display for Measured Parameter';
proc shewhart data=Parm;
   boxchart Measure*Wafer /
         nolimits
         boxstyle  = schematic
         idsymbol  = square
         readphase = all
         phaselegend
         nolegend;
label Measure = 'Measurement'
      Wafer   = 'Wafer Within Lot';
run;
The display is shown in Output 13.7.1. Here, the subgroup-variable is Wafer, and the option BOXSTYLE=SCHEMATIC is specified to request schematic box-and-whisker plots for the measurements in each subgroup (wafer) sample. The lot values are provided as the values of the special variable _PHASE_, which is read when the option READPHASE=ALL is specified. The option PHASELEGEND requests the legend for phase (lot) values at the top of the chart, and the NOLEGEND option suppresses the default legend for sample sizes. The NOLIMITS option suppresses the display of control limits. This option is recommended whenever you are using the BOXCHART statement to create side-by-side box-and-whisker plots.
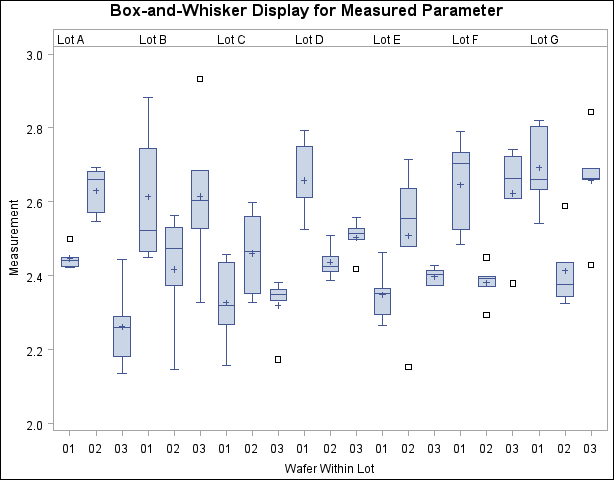
The box-and-whisker display in Output 13.7.1 is not particularly appropriate for these data since there are only five measurements in each wafer and since the variation within each wafer may depend on the position, which is not indicated. The next statements use the BOXCHART statement to produce a multi-vari chart for the same data.
symbol v=none;
title 'Multi-Vari Display for Measured Parameter';
proc shewhart data=Parm;
   boxchart Measure*Wafer /
      nolimits
      boxstyle          = pointsjoin
      idsymbol          = square
      cphaseboxfill     = ywh
      cphasebox         = black
      cphasemeanconnect = bib
      phasemeansymbol   = dot
      readphase         = all
      phaselegend
      nolegend;
label Measure = 'Measurement'
      Wafer   = 'Wafer Within Lot';
run;
The display is shown in Output 13.7.2.
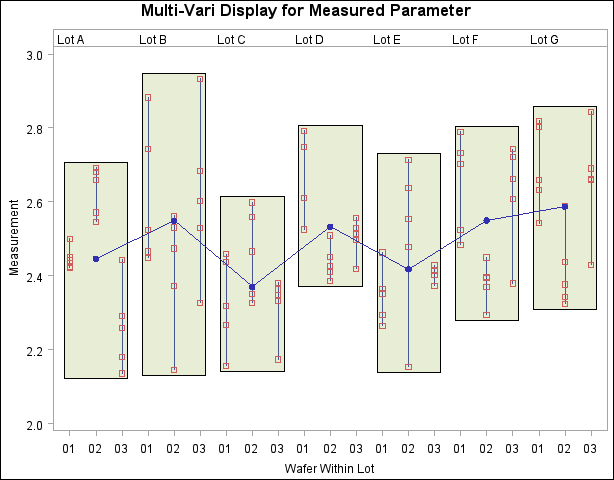
The option BOXSTYLE=POINTSJOIN specifies that the values for each wafer are to be displayed as points joined by a vertical line. The IDSYMBOL= option specifies the symbol marker for the points. The option V=NONE in the SYMBOL statement is specified to suppress the symbol for the wafer averages shown in Output 13.7.1. The option CPHASEBOX=BLACK specifies that the points for each lot are to be enclosed in a black box, and the CPHASEBOXFILL= option specifies the fill color for the box. The option CPHASEMEANCONNECT=BLACK specifies that the means of the lots are to be connected with black lines, and the PHASEMEANSYMBOL= option specifies the symbol marker for the lot means.
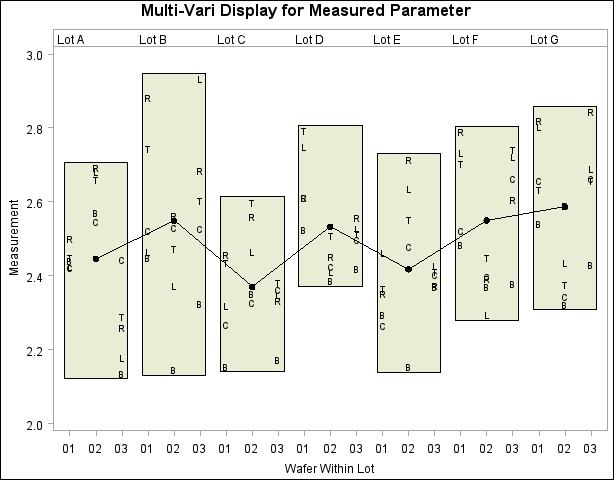
The following statements create a slightly different multi-vari chart using the values of the variable POSITION to identify the measurements for each wafer. Note that the option BOXSTYLE=POINTSID is specified and that POSITION is specified as the ID variable. The display is shown in Output 13.7.3.
symbol v=none;
title 'Multi-Vari Display for Measured Parameter';
proc shewhart data=Parm;
   boxchart Measure*Wafer /
      nolimits
      cphaseboxfill     = ywh
      cphasemeanconnect = black
      boxstyle          = pointsid
      phasemeansymbol   = dot
      readphase         = all
      phaselegend
      nolegend;
   label Measure = 'Measurement'
         Wafer   = 'Wafer Within Lot';
   id position;
run;
Copyright © SAS Institute, Inc. All Rights Reserved.