| The SHEWHART Procedure |
| Multivariate Control Charts |
[See SHWT2 in the SAS/QC Sample Library]In many industrial applications, the output of a process characterized by  variables that are measured simultaneously. Independent variables can be charted individually, but if the variables are correlated, a multivariate chart is needed to determine whether the process is in control.
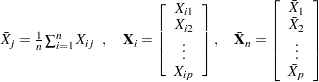
Many types of multivariate control charts have been proposed; refer to Alt (1985) for an overview. Denote the  th measurement on the
  th variable as
  for
for  , where
  is the number of measurements, and
  . Standard practice is to construct a chart for a statistic
  of the form
 |
where
 |
and
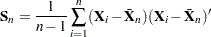 |
It is assumed that  has a -dimensional multivariate normal distribution with mean vector
 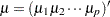 and covariance matrix
  for . Depending on the assumptions made about the parameters, a
  , Hotelling
  , or beta distribution is used for , and the percentiles of this distribution yield the control limits for the multivariate chart.
In this example, a multivariate control chart is constructed using a beta distribution for . The beta distribution is appropriate when the data are individual measurements (rather than subgrouped measurements) and when  and are estimated from the data being charted. In other words, this example illustrates a start-up phase chart where the control limits are determined from the data being charted.
Copyright © SAS Institute, Inc. All Rights Reserved.