| The RELIABILITY Procedure |
| Probability Distributions |
This section describes the probability distributions available in the RELIABILITY procedure for probability plotting and parameter estimation.
PROBPLOT and RELATIONPLOT Statements
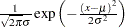
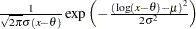
Probability plots can be constructed for each of the probability distributions in Table 12.49. Estimates of two distribution parameters (location and scale or scale and shape) are computed by maximum likelihood or by least squares fitted to points on the probability plot. If one of the parameters is specified as fixed, the other is estimated. In addition, you can specify a fixed threshold, or shift, parameter for those distributions for which a threshold parameter is indicated in Table 12.49. If you do not specify a threshold parameter, the threshold is set to 0.
Note that you should not interpret the parameters  and
and  as representing the means and standard deviations for all of the distributions in Table 12.49. The normal is the only distribution in Table 12.49 for which this is the case.
Parameters |
|||||
|---|---|---|---|---|---|
Distribution |
Density Function |
Location |
Scale |
Shape |
Threshold |
Normal |
|
|
|
||
Lognormal |
|
|
|
|
|
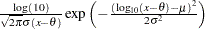
Lognormal |
|
|
|
|
|
(base 10) |
|||||
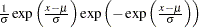
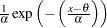
Extreme Value |
|
|
|
||
Weibull |
|
|
|
|
|
Exponential |
|
|
|
||
Logistic |
|
|
|
||
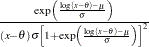
Log-logistic |
|
|
|
|
|


The exponential distribution shown in Table 12.49 is a special case of the Weibull distribution with  . The remaining distributions in Table 12.49 are related to one another as shown in Table 12.50. The threshold parameter,
  , is assumed to be 0 in Table 12.50.
Distribution of T |
Parameters |
Distribution of Y= |
Parameters |
||
|---|---|---|---|---|---|
Lognormal |
|
|
Normal |
|
|
Weibull |
|
|
Extreme Value |
|
|
Log-logistic |
|
|
Logistic |
|
|
 T
T 

MODEL Statement
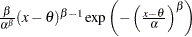
All of the distributions in Table 12.49 are available for regression model estimation by using the MODEL statement. In addition, you can fit regression models with the generalized gamma distribution with the following probability density function  :
:
 |
If a lifetime  has the generalized gamma distribution, then the logarithm of the lifetime
  has the generalized log-gamma distribution, with the following probability density function
  . When the gamma distribution is specified, the logarithms of the lifetimes are used as responses, and the generalized log-gamma distribution is used to estimate the parameters by maximum likelihood.
 |
See Lawless (2003) and Meeker and Escobar (1998) for a description of the generalized gamma and generalized log-gamma distributions.
When  , the generalized log-gamma distribution reduces to the extreme value distribution with parameters and . In this case, the log lifetimes have the extreme value distribution, or, equivalently, the lifetimes have the Weibull distribution with parameters
  and
and  . When
  , the generalized log-gamma reduces to the normal distribution with parameters and . In this case, the (unlogged) lifetimes have the lognormal distribution with parameters and . This chapter uses the notation for the location, for the scale, and
  for the shape parameters for the generalized log-gamma distribution.
ANALYZE Statement
You can use the ANALYZE statement to compute parameter estimates and other statistics for the distributions in Table 12.49. In addition, you can compute estimates for the binomial and Poisson distributions. The forms of these distributions are shown in the following table.
Distribution |
Pr{Y=y} |
Parameter |
Parameter Name |
|---|---|---|---|
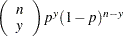
Binomial |
|
|
binomial probability |
Poisson |
|
|
Poisson mean |


Copyright © SAS Institute, Inc. All Rights Reserved.