| The RELIABILITY Procedure |
| Weibull Analysis Comparing Groups of Data |
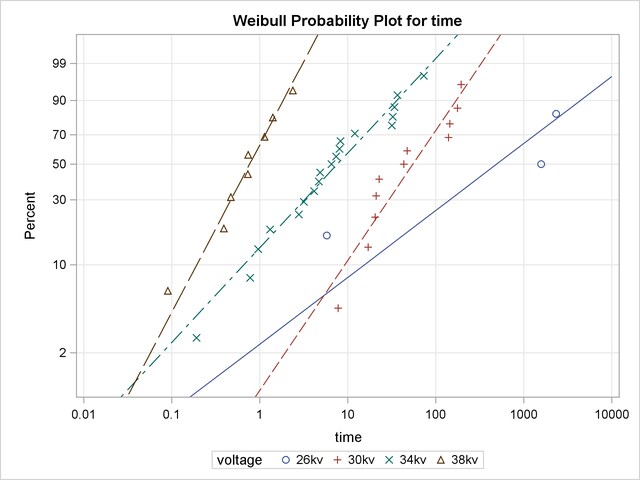
This example illustrates probability plotting and distribution fitting for data grouped by the levels of a special group-variable. The data are from an accelerated life test of an insulating fluid and are the times to electrical breakdown of the fluid under different high voltage levels. Each voltage level defines a subset of data for which a separate analysis and Weibull plot are produced. These data are the 26kV, 30kV, 34kV, and 38kV groups of the data provided by Nelson (1990, p. 129). The following statements create a SAS data set containing the lifetimes and voltages:
   data fluid;
       input time voltage$ @@;
       datalines;
       5.79    26kv    1579.52 26kv
       2323.7  26kv    7.74    30kv
       17.05   30kv    20.46   30kv
       21.02   30kv    22.66   30kv
       43.4    30kv    47.3    30kv
       139.07  30kv    144.12  30kv
       175.88  30kv    194.90  30kv
       .19     34kv    .78     34kv
       .96     34kv    1.31    34kv
       2.78    34kv    3.16    34kv
       4.15    34kv    4.67    34kv
       4.85    34kv    6.50    34kv
       7.35    34kv    8.01    34kv
       8.27    34kv    12.06   34kv
       31.75   34kv    32.52   34kv
       33.91   34kv    36.71   34kv
       72.89   34kv    .09     38kv
       .39     38kv    .47     38kv
       .73     38kv    .74     38kv
       1.13    38kv    1.40    38kv
       2.38    38kv
       ;
    run;
The variable Time provides the time to breakdown in minutes, and the variable Voltage provides the voltage level at which the test was conducted. These data are not censored.
The RELIABILITY procedure plots the data for the different voltage levels on the same Weibull probability plot, fits a separate distribution to the data at each voltage level, and superimposes distribution lines on the plot.
The following statements produce the probability plot shown in Figure 12.5 for the variable Time at each level of the group-variable Voltage:
proc reliability data=fluid;
   distribution weibull;
   pplot time=voltage  / overlay
                         noconf;
run;
The input data set FLUID is specified by the DATA= option in the PROC RELIABILITY statement. The PROBPLOT statement option OVERLAY specifies that plots for the groups are to be overlaid rather than displayed separately. The option NOCONF specifies that no confidence bands are to be plotted, since these can interfere with one another on overlaid plots; confidence bands are displayed by default.
A summary table that contains information for all groups is displayed. In addition, information identical to that shown in Figure 12.3 is tabulated for each level of voltage. The summary table for all groups and the tables for the 26kV group are shown in Figure 12.6 and Figure 12.7.
| Model Information - All Groups | |
|---|---|
| Input Data Set | WORK.FLUID |
| Analysis Variable | time |
| Distribution | Weibull |
| Estimation Method | Maximum Likelihood |
| Confidence Coefficient | 95% |
| Observations Used | 41 |
| Model Information - All Groups | |
|---|---|
| Input Data Set | WORK.FLUID |
| Analysis Variable | time |
| Distribution | Weibull |
| Estimation Method | Maximum Likelihood |
| Confidence Coefficient | 95% |
| Observations Used | 41 |
| Weibull Parameter Estimates | |||||
|---|---|---|---|---|---|
| Parameter | Estimate | Standard Error | Asymptotic Normal | Group | |
| 95% Confidence Limits | |||||
| Lower | Upper | ||||
| EV Location | 6.8625 | 1.1040 | 4.6986 | 9.0264 | 26kv |
| EV Scale | 1.8342 | 0.9611 | 0.6568 | 5.1226 | 26kv |
| Weibull Scale | 955.7467 | 1055.1862 | 109.7941 | 8319.6794 | 26kv |
| Weibull Shape | 0.5452 | 0.2857 | 0.1952 | 1.5226 | 26kv |
| Other Weibull Distribution Parameters | ||
|---|---|---|
| Parameter | Value | Group |
| Mean | 1649.4882 | 26kv |
| Mode | 0.0000 | 26kv |
| Median | 487.9547 | 26kv |
| Standard Deviation | 3279.0212 | 26kv |
| Weibull Percentile Estimates | |||||
|---|---|---|---|---|---|
| Percent | Estimate | Standard Error | Asymptotic Normal | Group | |
| 95% Confidence Limits | |||||
| Lower | Upper | ||||
| 0.1 | 0.00300636 | 0.02113841 | 3.11203E-9 | 2904.27046 | 26kv |
| 0.2 | 0.01072998 | 0.06838144 | 4.03597E-8 | 2852.65767 | 26kv |
| 0.5 | 0.0577713 | 0.31803193 | 1.19079E-6 | 2802.78862 | 26kv |
| 1 | 0.20695478 | 1.00385021 | 0.00001538 | 2784.16263 | 26kv |
| 2 | 0.74484901 | 3.12705686 | 0.00019885 | 2790.0941 | 26kv |
| 5 | 4.1142692 | 13.7388263 | 0.00591379 | 2862.3304 | 26kv |
| 10 | 15.406565 | 41.4763373 | 0.07873508 | 3014.69497 | 26kv |
| 20 | 61.0231127 | 125.020566 | 1.10053199 | 3383.65475 | 26kv |
| 30 | 144.246801 | 242.203982 | 5.36856883 | 3875.73303 | 26kv |
| 40 | 278.770459 | 398.048692 | 16.9761581 | 4577.77125 | 26kv |
| 50 | 487.954708 | 610.02855 | 42.0948552 | 5656.26835 | 26kv |
| 60 | 814.147288 | 920.537706 | 88.770543 | 7466.84412 | 26kv |
| 70 | 1343.42243 | 1433.97868 | 165.818889 | 10884.0666 | 26kv |
| 80 | 2287.87124 | 2445.52431 | 281.5628 | 18590.3635 | 26kv |
| 90 | 4412.96962 | 5148.34986 | 448.419608 | 43428.7452 | 26kv |
| 95 | 7150.89745 | 9248.2654 | 566.892142 | 90202.9338 | 26kv |
| 99 | 15735.8513 | 24666.0388 | 728.831025 | 339745.437 | 26kv |
| 99.9 | 33104.172 | 62018.1074 | 841.826189 | 1301796.28 | 26kv |
Copyright © SAS Institute, Inc. All Rights Reserved.