| The GAGE Application |
| Performing an Average and Range Analysis |
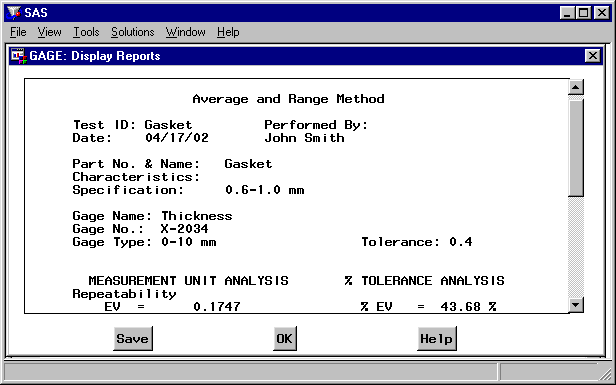
Press the Analysis button in the Measurements window and select Average/Range Method. The results are displayed, as shown in Figure A.12. You can scroll the report with the vertical scroll bar.
The complete listing of these results is shown in Figure A.24. A percent of tolerance analysis (against a tolerance value of 0.4mm) was requested in the General Information window. This appears on the right side of the report.
As with the charts, you can save this report in a file. Press the Save button to save the report. The Save Reports window appears, as shown in Figure A.13.
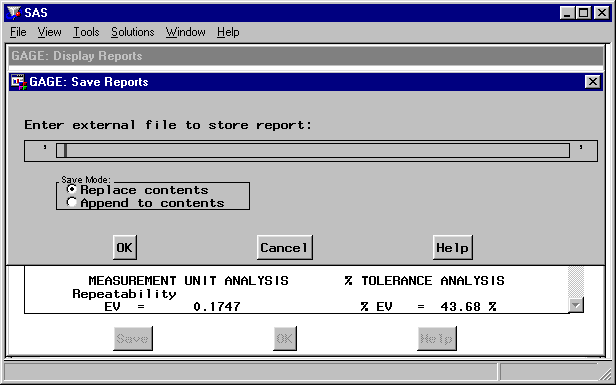
You enter the name of the file in which to store the report. You can select to have this listing replace what is currently in the file (if it exists) or be appended to the information stored in the file.
Press the Cancel button if you decide not to save the report. Press the OK button to save the report.
You return to the window displaying the average and range report. Press the OK button to leave the Display Reports window.
What would happen if you chose this method and there were missing data? Assume that operator Robert was unable to take the second measurement on the second part, and that data point is missing. If you run the average and range method on these data, you receive the message window shown in Figure A.14.
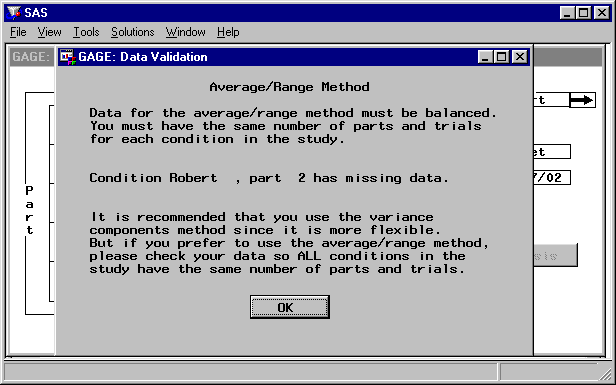
The variance components method can be used for these data.
Copyright © SAS Institute, Inc. All Rights Reserved.