| The CUSUM Procedure |
Example 6.2 Upper and Lower One-Sided Cusum Charts
[See CUSUPLO in the SAS/QC Sample Library]This example illustrates how to combine upper and lower one-sided cusum charts for means in the same display. As in the preceding example, OUTTABLE= data sets are created with the CUSUM procedure, and the display is created with the SHEWHART procedure.
The following statements analyze the variable Weight in the data set Oil (see Creating a V-Mask Cusum Chart from Raw Data). The first step is to compute and save upper and lower one-sided cusums for shifts of one standard error in the positive and negative directions.
proc cusum data=Oil;
   xchart Weight*Hour /
      nochart
      mu0=8.100        /* target mean for process  */
      sigma0=0.050     /* known standard deviation */
      delta=1          /* shift to be detected     */
      h=3              /* cusum parameter h        */
      k=0.5            /* cusum parameter k        */
      scheme=onesided
      outtable = tabupper
         ( drop   = _subx_ _subs_ _exlim_
           rename = ( _cusum_ = _subx_ _h_ = _uclx_ ) )
      ;
   xchart Weight*Hour /
      nochart
      mu0=8.100        /* target mean for process  */
      sigma0=0.050     /* known standard deviation */
      delta=-1         /* shift to be detected     */
      h=3              /* cusum parameter h        */
      k=0.5            /* cusum parameter k        */
      scheme=onesided
      outtable = tablower
         ( drop   = _var_ _subn_ _limitn_ _subx_ _subs_ _exlim_
           rename = ( _cusum_ = _subs_ _h_ = _ucls_ ) )
      ;
run;
Next, the OUTTABLE= data sets are merged.
data Tabboth;
   merge tabupper tablower; by Hour;
   _mean_   = _uclx_ * 0.5;
   _s_      = _ucls_ * 0.5;
   _lclx_   = 0.0;
   _lcls_   = 0.0;
run;
The variables _LCLX_ and _UCLX_ are assigned lower limits of zero for the cusums, and the variables _MEAN_ and _S_ are assigned dummy values. Now, Tabboth has the structure required for a TABLE= data set used with the XSCHART statement in the SHEWHART procedure (see TABLE= Data Set).
The final step is to read Tabboth as a TABLE= data set with the SHEWHART procedure.
title 'Upper and Lower Cusums';
proc shewhart table=Tabboth;
   xschart Weight * Hour /
      nolimitslegend
      ucllabel  = 'h=3.0'
      ucllabel2 = 'h=3.0'
      ypct1     = 50
      vref      = 1 2
      vref2     = 1 2
      noctl
      noctl2
      split = '/'
      nolegend ;
   label _subx_ = 'Upper Sum/Lower Sum';
run;
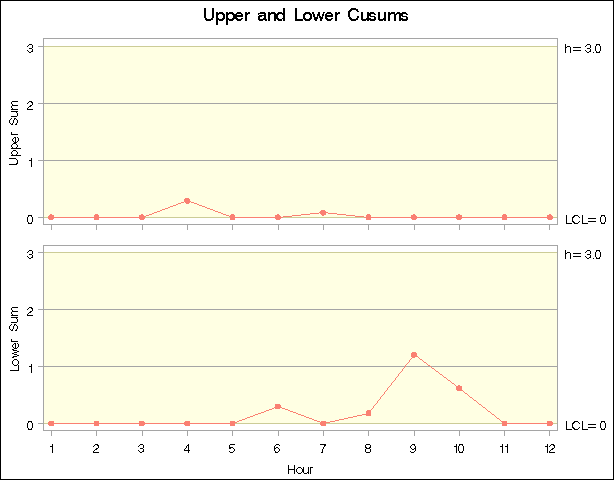
The combined display is shown in Output 6.2.1. There is no evidence of a shift in either direction.
Copyright © SAS Institute, Inc. All Rights Reserved.