| The CUSUM Procedure |
Creating a V-Mask Cusum Chart from Raw Data
[See CUSTWOS1 in the SAS/QC Sample Library]A machine fills eight-ounce cans of two-cycle engine oil additive. The filling process is believed to be in statistical control, and the process is set so that the average weight of a filled can is  ounces. Previous analysis shows that the standard deviation of fill weights is
  ounces. A two-sided cusum chart is used to detect shifts of at least one standard deviation in either the positive or negative direction from the target mean of 8.100 ounces.
Subgroup samples of four cans are selected every hour for twelve hours. The cans are weighed, and their weights are saved in a SAS data set named Oil.
data Oil;
   label Hour = 'Hour';
   input Hour @;
   do i=1 to 4;
      input Weight @;
      output;
      end;
   drop i;
datalines;
 1  8.024  8.135  8.151  8.065
 2  7.971  8.165  8.077  8.157
 3  8.125  8.031  8.198  8.050
 4  8.123  8.107  8.154  8.095
 5  8.068  8.093  8.116  8.128
 6  8.177  8.011  8.102  8.030
 7  8.129  8.060  8.125  8.144
 8  8.072  8.010  8.097  8.153
 9  8.066  8.067  8.055  8.059
10  8.089  8.064  8.170  8.086
11  8.058  8.098  8.114  8.156
12  8.147  8.116  8.116  8.018
;
run;
The data set Oil is partially listed in Figure 6.2.
Each observation contains one value of Weight along with its associated value of Hour, and the values of Hour are in increasing order. The CUSUM procedure assumes that DATA= input data sets are sorted in this "strung-out" form.
The following statements request a two-sided cusum chart with a V-mask for the average weights:
title 'Cusum Chart for Average Weights of Cans';
proc cusum data=Oil;
   xchart Weight*Hour /
      mu0    = 8.100           /* Target mean for process  */
      sigma0 = 0.050           /* Known standard deviation */
      delta  = 1               /* Shift to be detected     */
      alpha  = 0.10            /* Type I error probability */
      vaxis  = -5 to 3 ;
   label Weight = 'Cumulative Sum';
run;
The CUSUM procedure is invoked with the PROC CUSUM statement. The DATA= option in the PROC CUSUM statement specifies that the SAS data set Oil is to be read. The variables to be analyzed are specified in the XCHART statement. The process measurement variable (Weight) is specified before the asterisk (this variable is referred to more generally as a process). The time variable (Hour) is specified after the asterisk (this variable is referred to more generally as a subgroup-variable because it determines how the measurements are classified into rational subgroups).
The option ALPHA=0.10 specifies the probability of a Type 1 error for the cusum scheme (the probability of detecting a shift when none occurs).
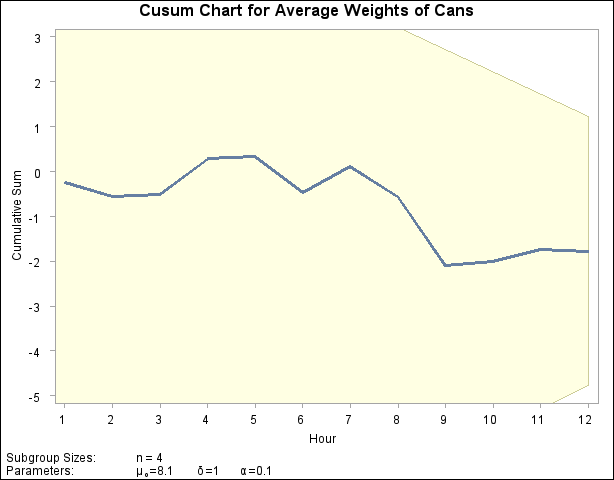
The cusum chart is shown in Figure 6.3.
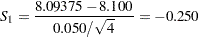
The cusum  plotted at Hour=1 is simply the standardized deviation of the first subgroup mean from the target mean.
 |
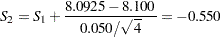
The cusum  plotted at Hour=2 is plus the standardized deviation of the second subgroup mean from the target mean.
 |
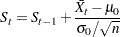
In general, the cusum plotted at Hour= is
is  plus the standardized deviation of the th subgroup mean from the target mean.
 |
For further details, see Two-Sided Cusum Schemes.
You can interpret the chart by comparing the points with the V-mask whose right edge is centered at the most recent point (Hour=12). Since none of the points cross the arms of the V-mask, there is no evidence that a shift has occurred, and the fluctuations in the cusums can be attributed to chance variation. In general, crossing the lower arm is evidence of an increase in the process mean, whereas crossing the upper arm is evidence of a decrease in the mean.
Copyright © SAS Institute, Inc. All Rights Reserved.