| The ANOM Procedure |
Creating ANOM Charts for Proportions from Group Counts
[See ANMP1 in the SAS/QC Sample Library]A health care system administrator uses ANOM to compare cesarean section rates for a set of medical groups. For more background concerning this application, refer to Rodriguez (1996).
The following statements create a SAS data set named Csection, which contains the number of c-sections and the total number of deliveries for each medical group over a one-year period.
data Csection;
   length ID $ 2;
   input ID Csections Total @@;
   label ID = 'Medical Group Identification Number';
   datalines;
1A  150  923 1K   45  298 1B   34  170 1D   18  132
3I   20  106 3M   12  105 1E   10   77 1N   19   74
1Q    7   69 3H   11   65 1R   11   49 1H    9   48
3J    7   20 1C    8   43 3B    6   43 1M    4   29
3C    5   28 1O    4   27 1J    6   22 1T    3   22
3E    4   18 1G    4   15 3D    4   13 3G    1   11
1L    2   10 1I    1    8 1P    0    3 1F    0    3
1S    1    3
;
run;
A partial listing of CSECTION is shown in Figure 4.1.2.
The variable ID identifies the medical groups and is referred to as the group-variable. The variable Csections provides the number of c-sections, and is referred to as the response variable (or response for short). The variable Total provides the total number of deliveries.
The following statements create the  chart shown in Figure 4.1.3:
symbol v=none;
title 'Analysis of C-Sections';
proc anom data=Csection;
   pchart Csections*ID / groupn   = Total
                         hoffset  = 2
                         nolegend
                         turnhlabels;
   label Csections = 'Proportion of Cesarean Sections';
run;
This example illustrates the basic form of the PCHART statement. After the keyword PCHART, you specify the response to analyze (in this case, Csections, followed by an asterisk and the group-variable ID.
The input data set is specified with the DATA= option in the PROC ANOM statement. The GROUPN= option specifies the sample size in each group and is required with a DATA= input data set. The GROUPN= option specifies one of the following:
a constant group sample size
a variable in the input data set whose values provide the group sample sizes (in this case, Total)
The TURNHLABELS option turns the horizontal axis labels since the default labeling skips labels if the characters exceed the space alloted. See Axis and Axis Label Options. To angle the axis labels, see Example 4.2.
Options such as GROUPN= and TURNHLABELS are specified after the slash (/) in the PCHART statement. A complete list of options is presented in the section Syntax.
Chart for Cesarean Sections
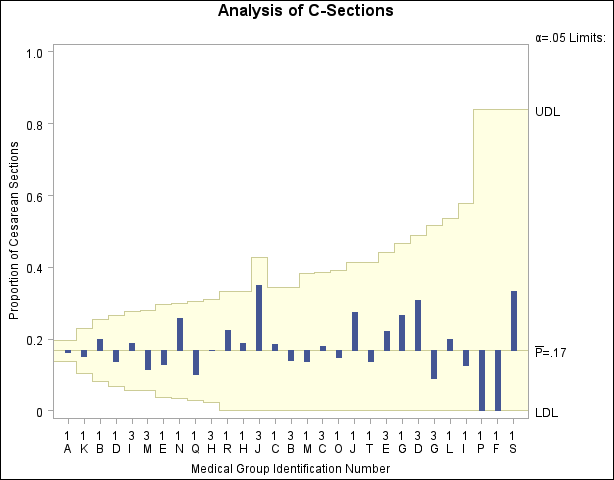
Each point on the chart represents the proportion of c-sections for a particular group. For instance, the value plotted for group 1A is  .
.
Since all the points fall within the decision limits, it can be concluded that the variation in proportions of c-sections across medical groups is strictly due to chance.
By default, the decision limits shown correspond to a significance level of  . This means that, assuming all groups have the same proportion of c-sections, there is a 0.05 probability that one or more of the decision limits would be exceeded purely by chance. The formulas for the limits are given in Decision Limits. Note that the decision limits vary with the number of deliveries in each group, and the widest limits correspond to the group with the smallest number of deliveries.
For more details on reading group counts, see DATA= Data Set.
Copyright © SAS Institute, Inc. All Rights Reserved.