| The ANOM Procedure |
Constructing ANOM Charts for Proportions
The following notation is used in this section:
|
response number (count) in the |
||||
|
number of groups |
||||
|
sample size of the |
||||
|
total sample size |
||||
|
proportion in the |
||||
|
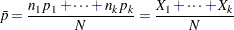
weighted average of proportions across groups:
|
||||
|
significance level |
||||
|
critical value for ANOM for normal data in the balanced case |
||||
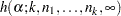
|
critical value for ANOM for normal data in the unbalanced case |


 ) for a group.
 Central Line
By default, the central line on an ANOM  chart is computed as
  , the weighted average of the group proportions. You can specify with the P= option or with the variable _P_ in a LIMITS= data set.
Decision Limits
For the  th group, the response counts are assumed to have the binomial distribution
  . The ANOM method for proportions tests the null hypothesis that
  , that is, that the proportions are the same, against the alternative that at least one of the
  ’s is different from the average of the
  proportions.
The decision limits are computed using the normal approximation to the binomial distribution, which is appropriate when the sample sizes for the groups are large; refer to Ramig (1983). A commonly recommended check for this assumption is that  and
and  for all the groups. The critical values in the ANOM method for normally distributed data are adapted to the binomial case by using infinite degrees of freedom for the variance.
When the sample sizes are constant across groups ( ), the decision limits are computed as follows:
 |
 |
 |
|||
 |
|
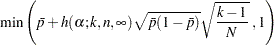 |
For the theoretical derivation of the decision limits, refer to Nelson (1982a).
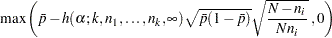
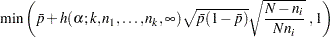
When the sample sizes ( ) are different across groups (the unbalanced case), the decision limits are computed as follows:
|
|
 |
|||
|
|
 |
Note that the decision limits for the th group depend on . If the sample sizes are constant across groups (), the decision limits in the unbalanced case reduce to the formulas given for the balanced case since  and
and  so
so
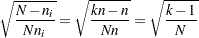 |
For the derivation of the decision limits for unequal sample sizes, refer to Nelson (1991).
Exact critical values  were first tabulated by L. S. Nelson (1983). Refer to Nelson (1993) for derivation of critical values.
You can specify parameters for the limits as follows:
Specify
 with the ALPHA= option or with the variable _ALPHA_ in a LIMITS= data set. By default, = 0.05.
 Specify a constant nominal sample size
 for the decision limits with the LIMITN= option or with the variable _LIMITN_ in a LIMITS= data set. By default,
  is the observed sample size in the balanced case.
 Specify
with the P= option or with the variable _P_ in a LIMITS= data set. By default, is the weighted average of the group proportions.
Copyright © SAS Institute, Inc. All Rights Reserved.