The CORR Procedure
- Overview
- Getting Started
-
Syntax

-
DetailsPearson Product-Moment CorrelationSpearman Rank-Order CorrelationKendall’s Tau-b Correlation CoefficientHoeffding Dependence CoefficientPartial CorrelationFisher’s z TransformationPolychoric CorrelationPolyserial CorrelationCronbach’s Coefficient AlphaConfidence and Prediction EllipsesMissing ValuesIn-Database ComputationOutput TablesOutput Data SetsODS Table NamesODS Graphics
-
ExamplesComputing Four Measures of AssociationComputing Correlations between Two Sets of VariablesAnalysis Using Fisher’s z TransformationApplications of Fisher’s z TransformationComputing Polyserial CorrelationsComputing Cronbach’s Coefficient AlphaSaving Correlations in an Output Data SetCreating Scatter PlotsComputing Partial Correlations
- References
A partial correlation measures the strength of the linear relationship between two variables, while adjusting for the effect of other variables.
The following statements request a partial correlation analysis of variables Height and Width while adjusting for the variables Length3 and Weight. The latter variables, which are said to be “partialled out” of the analysis, are specified with the PARTIAL statement.
ods graphics on;
title 'Fish Measurement Data';
proc corr data=fish1 plots=scatter(alpha=.20 .30);
   var Height Width;
   partial Length3 Weight3;
run;
ods graphics off;
Output 2.9.1 displays descriptive statistics for all the variables. The partial variance and partial standard deviation for the variables in the VAR statement are also displayed.
Output 2.9.1: Descriptive Statistics
| Fish Measurement Data |
| 2 Partial Variables: | Length3 Weight3 |
|---|---|
| 2 Variables: | Height Width |
| Simple Statistics | ||||||||
|---|---|---|---|---|---|---|---|---|
| Variable | N | Mean | Std Dev | Sum | Minimum | Maximum | Partial Variance |
Partial Std Dev |
| Length3 | 34 | 38.38529 | 4.21628 | 1305 | 30.00000 | 46.50000 | ||
| Weight3 | 34 | 8.44751 | 0.97574 | 287.21524 | 6.23168 | 10.00000 | ||
| Height | 34 | 15.22057 | 1.98159 | 517.49950 | 11.52000 | 18.95700 | 0.26607 | 0.51582 |
| Width | 34 | 5.43805 | 0.72967 | 184.89370 | 4.02000 | 6.74970 | 0.07315 | 0.27047 |
When you specify a PARTIAL statement, observations with missing values are excluded from the analysis. Output 2.9.2 displays partial correlations for the variables in the VAR statement.
Output 2.9.2: Pearson Partial Correlation Coefficients
| Pearson Partial Correlation Coefficients, N = 34 Prob > |r| under H0: Partial Rho=0 |
||||||
|---|---|---|---|---|---|---|
| Height | Width | |||||
| Height |
|
|
||||
| Width |
|
|
||||
The partial correlation between the variables Height and Width is 0.25692, which is much less than the unpartialled correlation, 0.92632 (in Output 2.9.2). The ![]() -value for the partial correlation is 0.1558.
-value for the partial correlation is 0.1558.
The PLOTS=SCATTER option displays (in Output 2.9.3) a scatter plot of the residuals for the variables Height and Width after controlling for the effect of variables Length3 and Weight. The ALPHA=.20 .30 suboption requests ![]() and
and ![]() prediction ellipses, respectively.
prediction ellipses, respectively.
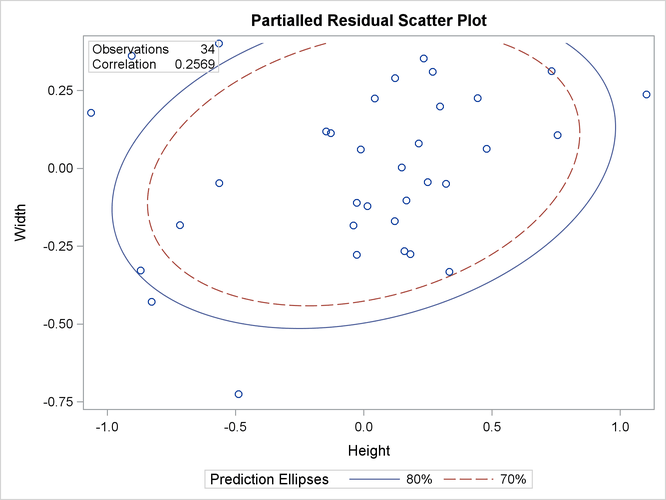
In Output 2.9.3, a standard deviation of Height has roughly the same length on the X axis as a standard deviation of Width on the Y axis. The major axis length is not significantly larger than the minor axis length, indicating a weak partial correlation
between Height and Width.