The CORR Procedure
- Overview
- Getting Started
-
Syntax

-
DetailsPearson Product-Moment CorrelationSpearman Rank-Order CorrelationKendall’s Tau-b Correlation CoefficientHoeffding Dependence CoefficientPartial CorrelationFisher’s z TransformationPolychoric CorrelationPolyserial CorrelationCronbach’s Coefficient AlphaConfidence and Prediction EllipsesMissing ValuesIn-Database ComputationOutput TablesOutput Data SetsODS Table NamesODS Graphics
-
ExamplesComputing Four Measures of AssociationComputing Correlations between Two Sets of VariablesAnalysis Using Fisher’s z TransformationApplications of Fisher’s z TransformationComputing Polyserial CorrelationsComputing Cronbach’s Coefficient AlphaSaving Correlations in an Output Data SetCreating Scatter PlotsComputing Partial Correlations
- References
This example produces a correlation analysis with descriptive statistics and four measures of association: the Pearson product-moment
correlation, the Spearman rank-order correlation, Kendall’s tau-b coefficients, and Hoeffding’s measure of dependence, ![]() .
.
The Fitness data set created in the section Getting Started: CORR Procedure contains measurements from a study of physical fitness of 31 participants. The following statements request all four measures
of association for the variables Weight, Oxygen, and Runtime:
ods graphics on;
title 'Measures of Association for a Physical Fitness Study';
proc corr data=Fitness pearson spearman kendall hoeffding
          plots=matrix(histogram);
   var Weight Oxygen RunTime;
run;
ods graphics off;
Note that Pearson correlations are computed by default only if all three nonparametric correlations (SPEARMAN, KENDALL, and HOEFFDING) are not specified. Otherwise, you need to specify the PEARSON option explicitly to compute Pearson correlations.
The “Simple Statistics” table in Output 2.1.1 displays univariate descriptive statistics for analysis variables. By default, observations with nonmissing values for each variable are used to derive the univariate statistics for that variable. When nonparametric measures of association are specified, the procedure displays the median instead of the sum as an additional descriptive measure.
Output 2.1.1: Simple Statistics
| Measures of Association for a Physical Fitness Study |
| 3 Variables: | Weight Oxygen RunTime |
|---|
| Simple Statistics | ||||||
|---|---|---|---|---|---|---|
| Variable | N | Mean | Std Dev | Median | Minimum | Maximum |
| Weight | 31 | 77.44452 | 8.32857 | 77.45000 | 59.08000 | 91.63000 |
| Oxygen | 29 | 47.22721 | 5.47718 | 46.67200 | 37.38800 | 60.05500 |
| RunTime | 29 | 10.67414 | 1.39194 | 10.50000 | 8.17000 | 14.03000 |
The “Pearson Correlation Coefficients” table in Output 2.1.2 displays Pearson correlation statistics for pairs of analysis variables. The Pearson correlation is a parametric measure of association for two continuous random variables. When there are missing data, the number of observations used to calculate the correlation can vary.
Output 2.1.2: Pearson Correlation Coefficients
| Pearson Correlation Coefficients Prob > |r| under H0: Rho=0 Number of Observations |
||||||||||||
|---|---|---|---|---|---|---|---|---|---|---|---|---|
| Weight | Oxygen | RunTime | ||||||||||
| Weight |
|
|
|
|||||||||
| Oxygen |
|
|
|
|||||||||
| RunTime |
|
|
|
|||||||||
The table shows that the Pearson correlation between Runtime and Oxygen is ![]() 0.86843, which is significant with a
0.86843, which is significant with a ![]() -value less than 0.0001. This indicates a strong negative linear relationship between these two variables. As
-value less than 0.0001. This indicates a strong negative linear relationship between these two variables. As Runtime increases, Oxygen decreases linearly.
The Spearman rank-order correlation is a nonparametric measure of association based on the ranks of the data values. The “Spearman Correlation Coefficients” table in Output 2.1.3 displays results similar to those of the “Pearson Correlation Coefficients” table in Output 2.1.2.
Output 2.1.3: Spearman Correlation Coefficients
| Spearman Correlation Coefficients Prob > |r| under H0: Rho=0 Number of Observations |
||||||||||||
|---|---|---|---|---|---|---|---|---|---|---|---|---|
| Weight | Oxygen | RunTime | ||||||||||
| Weight |
|
|
|
|||||||||
| Oxygen |
|
|
|
|||||||||
| RunTime |
|
|
|
|||||||||
Kendall’s tau-b is a nonparametric measure of association based on the number of concordances and discordances in paired observations. The “Kendall Tau b Correlation Coefficients” table in Output 2.1.4 displays results similar to those of the “Pearson Correlation Coefficients” table in Output 2.1.2.
Output 2.1.4: Kendall’s Tau-b Correlation Coefficients
| Kendall Tau b Correlation Coefficients Prob > |tau| under H0: Tau=0 Number of Observations |
||||||||||||
|---|---|---|---|---|---|---|---|---|---|---|---|---|
| Weight | Oxygen | RunTime | ||||||||||
| Weight |
|
|
|
|||||||||
| Oxygen |
|
|
|
|||||||||
| RunTime |
|
|
|
|||||||||
Hoeffding’s measure of dependence, ![]() , is a nonparametric measure of association that detects more general departures from independence. Without ties in the variables,
the values of the
, is a nonparametric measure of association that detects more general departures from independence. Without ties in the variables,
the values of the ![]() statistic can vary between
statistic can vary between ![]() and
and ![]() , with
, with ![]() indicating complete dependence. Otherwise, the
indicating complete dependence. Otherwise, the ![]() statistic can result in a smaller value. The “Hoeffding Dependence Coefficients” table in Output 2.1.5 displays Hoeffding dependence coefficients. Since ties occur in the variable
statistic can result in a smaller value. The “Hoeffding Dependence Coefficients” table in Output 2.1.5 displays Hoeffding dependence coefficients. Since ties occur in the variable Weight, the ![]() statistic for the
statistic for the Weight variable is less than ![]() .
.
Output 2.1.5: Hoeffding’s Dependence Coefficients
| Hoeffding Dependence Coefficients Prob > D under H0: D=0 Number of Observations |
||||||||||||
|---|---|---|---|---|---|---|---|---|---|---|---|---|
| Weight | Oxygen | RunTime | ||||||||||
| Weight |
|
|
|
|||||||||
| Oxygen |
|
|
|
|||||||||
| RunTime |
|
|
|
|||||||||
When you use the PLOTS=MATRIX(HISTOGRAM) option, the CORR procedure displays a symmetric matrix plot for the analysis variables listed in the VAR statement (Output 2.1.6).
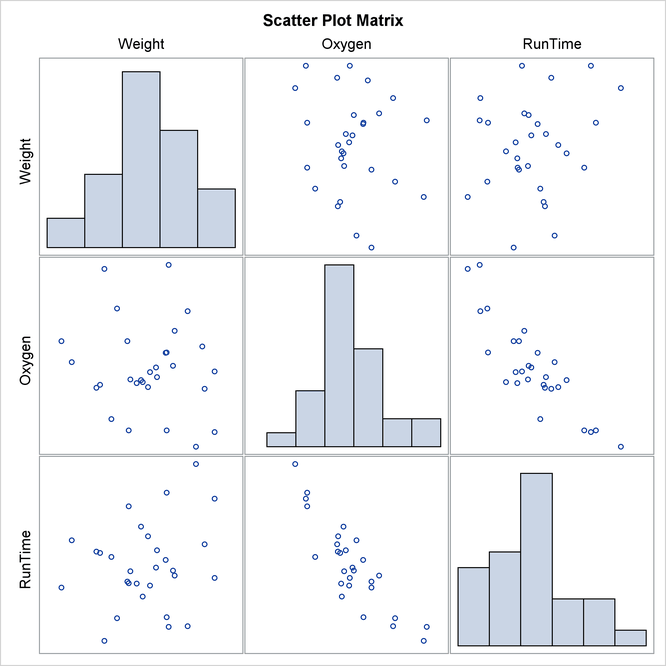
The strong negative linear relationship between Oxygen and Runtime is evident in Output 2.1.6.
Note that this graphical display is requested by enabling ODS Graphics and by specifying the PLOTS= option. For more information about ODS Graphics, see Chapter 21: Statistical Graphics Using ODS in SAS/STAT User's Guide.