FCMP Procedure
- Syntax

- Overview
- Concepts
- Using
- Examples Creating a Function and Calling the Function from a DATA StepCreating a CALL Routine and a FunctionUsing Numeric Data in the FUNCTION StatementUsing Character Data in the FUNCTION StatementUsing Variable Arguments with an ArrayUsing the SUBROUTINE Statement with a CALL StatementUsing GTL with User-Defined FunctionsStandardizing Each Row of a Data Set
Example 7: Using GTL with User-Defined Functions
| Features: |
|
Program
proc fcmp outlib=sasuser.funcs.curves;
   function oscillate(x,amplitude,frequency);
         if amplitude le 0 then amp=1; else amp=amplitude;
	      if frequency le 0 then freq=1; else freq=frequency;
         y=sin(freq*x)*constant("e")**(-amp*x);
         return (y);
  endsub;
 function oscillateBound(x,amplitude);
       if amplitude le 0 then amp=1; else amp=amplitude;
       y=constant("e")**(-amp*x);
       return (y);
  endsub;
 run;
 options cmplib=sasuser.funcs;

data range;
   do Time=0 to 2 by .01;
   output;
   end;
run;
proc template ;
define statgraph damping;
dynamic X AMP FREQ;
begingraph;
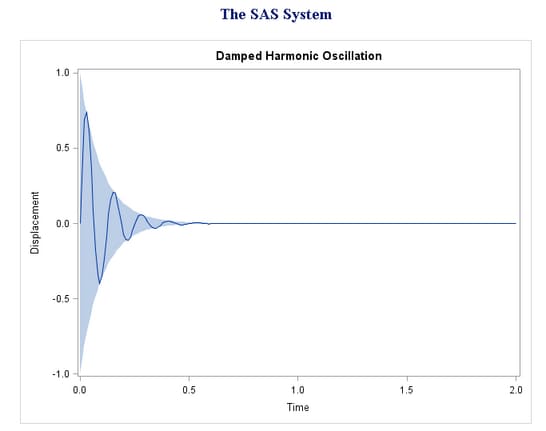
entrytitle "Damped Harmonic Oscillation";
layout overlay / yaxisopts=(label="Displacement");
if (exists(X) and exists(AMP) and exists(FREQ))
bandplot x=X limitlower=eval(-oscillateBound(X,AMP))
limitupper=eval(oscillateBound(X,AMP));
seriesplot x=X y=eval(oscillate(X,AMP,FREQ));
endif;
endlayout;
endgraph;
end;
run;
 proc sgrender data=range template=damping;
      dynamic x="Time" amp=10 freq=50 ;
 run;
Program Description
proc fcmp outlib=sasuser.funcs.curves;
   function oscillate(x,amplitude,frequency);
         if amplitude le 0 then amp=1; else amp=amplitude;
	      if frequency le 0 then freq=1; else freq=frequency;
         y=sin(freq*x)*constant("e")**(-amp*x);
         return (y);
endsub; function oscillateBound(x,amplitude);
if amplitude le 0 then amp=1; else amp=amplitude;
y=constant("e")**(-amp*x);
return (y);
endsub;
run;
proc template ;
   define statgraph damping;
   dynamic X AMP FREQ;
   begingraph;
       entrytitle "Damped Harmonic Oscillation";
       layout overlay / yaxisopts=(label="Displacement");
          if (exists(X) and exists(AMP) and exists(FREQ))
	            bandplot x=X  limitlower=eval(-oscillateBound(X,AMP))
                limitupper=eval(oscillateBound(X,AMP));
                seriesplot x=X y=eval(oscillate(X,AMP,FREQ));
	      endif;
	    endlayout;
   endgraph;
   end;
   run;