| Analyzing the Sample Path |
Server Utilization
The utilization of a server is another measure of system
performance that is often of interest.
Estimates on the probability that a server is busy
is one statistic for measuring utilization.
If after collecting data using the Collect Data
check box on the Simulation Control panel,
you select a server from the components list box
and click the Analyze
button, you get a
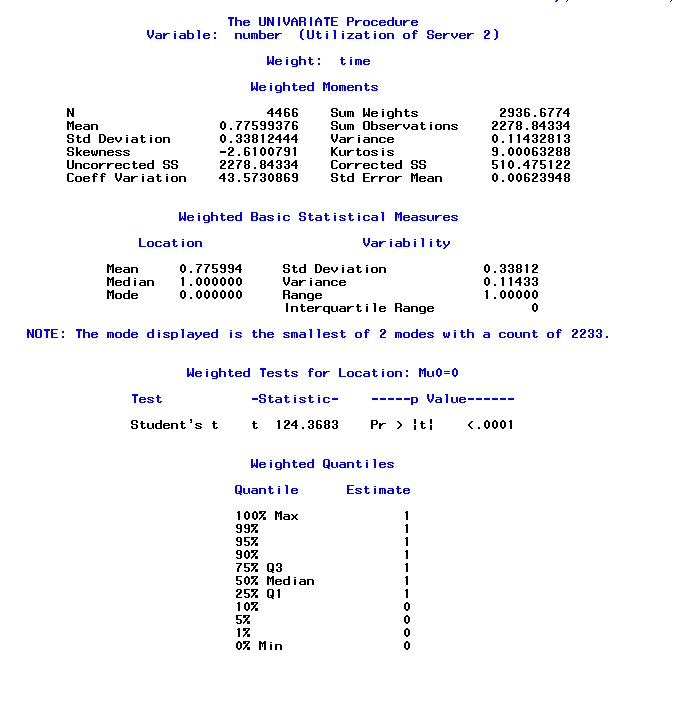
printout similar to that shown in Figure 9.9.

|
Figure 9.9: Statistics on Server Utilization
The mean shown is approximately .77.
This is an estimate of the probability that the server is busy.

|
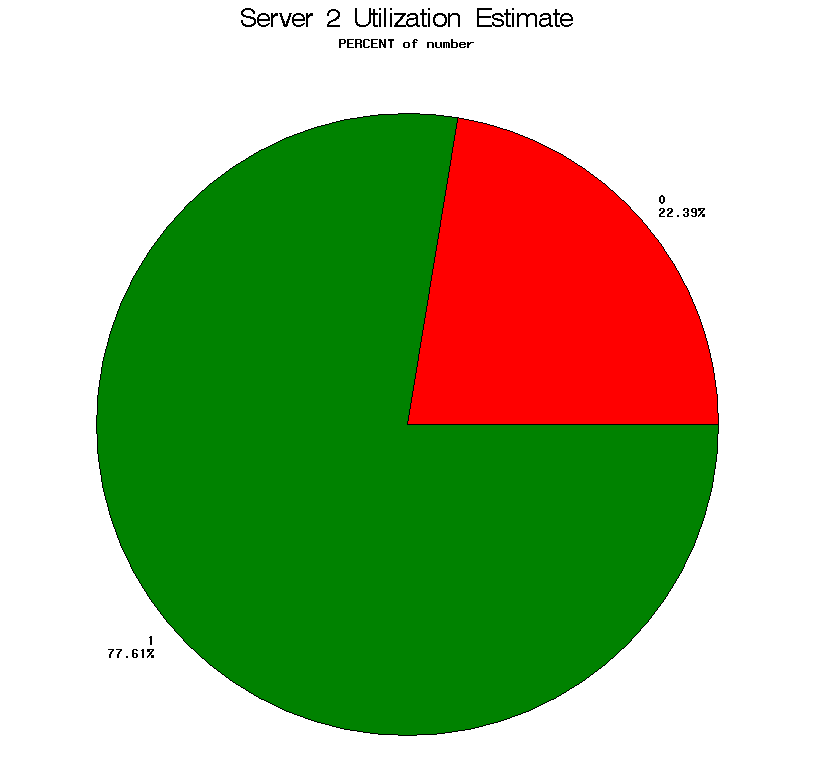
Figure 9.10: Server Utilization
The pie chart in Figure 9.10 shows the percent of time that the server is busy.
Another way to get Server Utilization Statistics
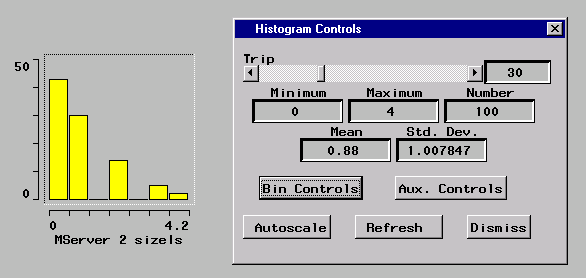
Another way to view server utilization statistics is with a chart component. One component that can be used is the VHistogram. Figure 9.11 shows a VHistogram and a Histogram control panel. This histogram had an MServer dropped on it and is monitoring the number of busy servers.

|
Figure 9.11: Histogram of Server Utilization
Copyright © 2008 by SAS Institute Inc., Cary, NC, USA. All rights reserved.