| Building a Model with Elementary Components |
Histogram
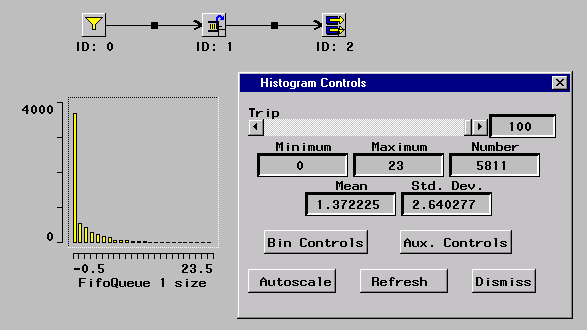
The histogram shows a distribution histogram of the selected attribute.
The Histogram control panel shows the minimum, maximum, number, mean, and standard deviation
of the attribute that it is monitoring.
This attribute can be named in a bucket that is dropped on the histogram
or can be one of the states of a component that is dropped on
the histogram.
If a bucket is dropped on the histogram, then the bin controls
for the histogram are those of the bucket.
If a component is dropped on the histogram, then the bin controls
are associated with the histogram and are accessible from
the histogram control panel.

|
Figure 3.17: A Histogram and Control Panel
The histogram control panel has buttons to enable or disable automatic scaling, refresh the plot, raise the local bin controls, and to specify auxiliary controls. The latter two buttons apply if you drop a component on a histogram.
You can also drop histograms onto other histograms. This enables you to collect statistics on the minimum, maximum, mean, and standard deviation of the attribute. It is a type of batch means.
Copyright © 2008 by SAS Institute Inc., Cary, NC, USA. All rights reserved.