The NETDRAW Procedure
- Overview
- Getting Started
-
Syntax

-
Details
 Network Input Data SetVariables in the Network Data SetMissing ValuesLayout of the NetworkFormat of the DisplayPage FormatLayout Data SetControlling the LayoutTime-Scaled Network DiagramsZoned Network DiagramsOrganizational Charts or Tree DiagramsFull-Screen VersionGraphics VersionUsing the Annotate FacilityWeb-Enabled Network DiagramsMacro Variable _ORNETDRComputer Resource RequirementsODS Style Templates
 -
Examples
 Line-Printer Network DiagramGraphics Version of PROC NETDRAWSpanning Multiple PagesThe COMPRESS and PCOMPRESS OptionsControlling the Display FormatNonstandard Precedence RelationshipsControlling the Arc-Routing AlgorithmPATTERN and SHOWSTATUS OptionsTime-Scaled Network DiagramFurther Time-Scale OptionsZoned Network DiagramSchematic DiagramsModifying Network LayoutSpecifying Node PositionsOrganizational Charts with PROC NETDRAWAnnotate Facility with PROC NETDRAWAOA Network Using the Annotate FacilityBranch and Bound TreesStatement and Option Cross-Reference Tables
 - References
Example 9.15 Organizational Charts with PROC NETDRAW
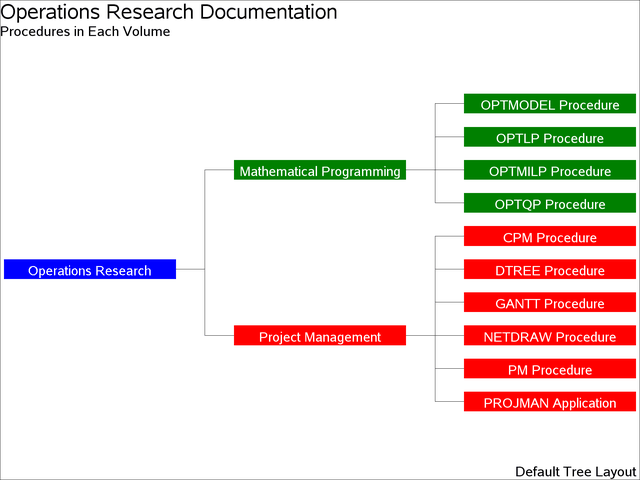
This example illustrates using the TREE option to draw organizational charts. The Network data set, DOCUMENT, describes how the procedures are distributed between two volumes of the SAS/OR documentation. The structure can be visualized
easily in a tree diagram. The data set DOCUMENT contains the parent-child relationship for each node of the diagram. For each node, a detailed description is contained in
the variable ID. In addition, the variable _pattern specifies the pattern to be used for each node. PROC NETDRAW is invoked with the TREE option, which illustrates the organization
of the documentation in the form of a tree diagram drawn from left to right. The CENTERID option centers text within each
node. Arrowheads are not necessary for this diagram and are suppressed by specifying ARROWHEAD=0. Output 9.15.1 shows the resulting diagram.
data document;
   format parent child $8. id $24.;
   input parent $ child $ id & _pattern;
   datalines;
OR       MPBOOK     Operations Research       1
OR       PMBOOK     Operations Research       1
PMBOOK   CPM        Project Management        2
PMBOOK   DTREE      Project Management        2
PMBOOK   GANTT      Project Management        2
PMBOOK   NETDRAW    Project Management        2
PMBOOK   PM         Project Management        2
PMBOOK   PROJMAN    Project Management        2
MPBOOK   OPTMODEL   Mathematical Programming  3
MPBOOK   OPTLP      Mathematical Programming  3
MPBOOK   OPTMILP    Mathematical Programming  3
MPBOOK   OPTQP      Mathematical Programming  3
CPM      .          CPM Procedure             2
DTREE    .          DTREE Procedure           2
GANTT    .          GANTT Procedure           2
NETDRAW  .          NETDRAW Procedure         2
PM       .          PM Procedure              2
PROJMAN  .          PROJMAN Application       2
OPTMODEL .          OPTMODEL Procedure        3
OPTLP    .          OPTLP Procedure           3
OPTMILP  .          OPTMILP Procedure         3
OPTQP    .          OPTQP Procedure           3
;
pattern1 v=s c=blue;
pattern2 v=s c=red;
pattern3 v=s c=green;

title j=l h=3 'Operations Research Documentation';
title2 j=l h=2 'Procedures in Each Volume';
footnote j=r h=2 'Default Tree Layout ';
proc netdraw graphics data=document;
   actnet / act=parent
            succ=child
            id=(id)
            nodefid
            nolabel
            pcompress
            centerid
            tree
            xbetween=15
            ybetween=3
            arrowhead=0
            rectilinear
            carcs=black
            ctext=white
            htext=3;
   run;
Output 9.15.1: Organization of Documentation: Default TREE Layout

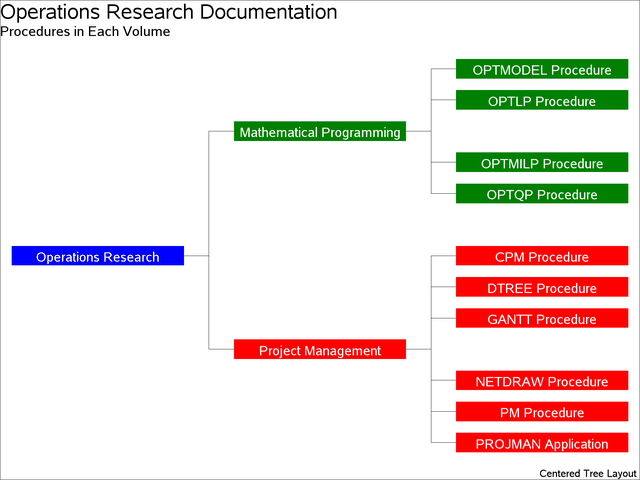
The procedure draws the tree compactly with the successors of each node being placed to the immediate right of the node, ordered from top to bottom in the order of occurrence in the Network data set. The next invocation of PROC NETDRAW illustrates the effect of the SEPARATESONS and CENTERSUBTREE options on the layout of the tree (see Output 9.15.2).
footnote j=r h=1.5 'Centered Tree Layout ';
proc netdraw graphics data=document;
   actnet / act=parent
            succ=child
            id=(id)
            nodefid
            nolabel
            pcompress
            novcenter
            centerid
            tree
            separatesons
            centersubtree
            xbetween=15
            ybetween=3
            arrowhead=0
            rectilinear
            carcs=black
            ctext=white
            htext=3.5;
   run;
Output 9.15.2: Organization of Documentation: Controlled TREE Layout
