The NETDRAW Procedure
- Overview
- Getting Started
-
Syntax

-
DetailsNetwork Input Data SetVariables in the Network Data SetMissing ValuesLayout of the NetworkFormat of the DisplayPage FormatLayout Data SetControlling the LayoutTime-Scaled Network DiagramsZoned Network DiagramsOrganizational Charts or Tree DiagramsFull-Screen VersionGraphics VersionUsing the Annotate FacilityWeb-Enabled Network DiagramsMacro Variable _ORNETDRComputer Resource RequirementsODS Style Templates
-
ExamplesLine-Printer Network DiagramGraphics Version of PROC NETDRAWSpanning Multiple PagesThe COMPRESS and PCOMPRESS OptionsControlling the Display FormatNonstandard Precedence RelationshipsControlling the Arc-Routing AlgorithmPATTERN and SHOWSTATUS OptionsTime-Scaled Network DiagramFurther Time-Scale OptionsZoned Network DiagramSchematic DiagramsModifying Network LayoutSpecifying Node PositionsOrganizational Charts with PROC NETDRAWAnnotate Facility with PROC NETDRAWAOA Network Using the Annotate FacilityBranch and Bound TreesStatement and Option Cross-Reference Tables
- References
Example 9.3 Spanning Multiple Pages
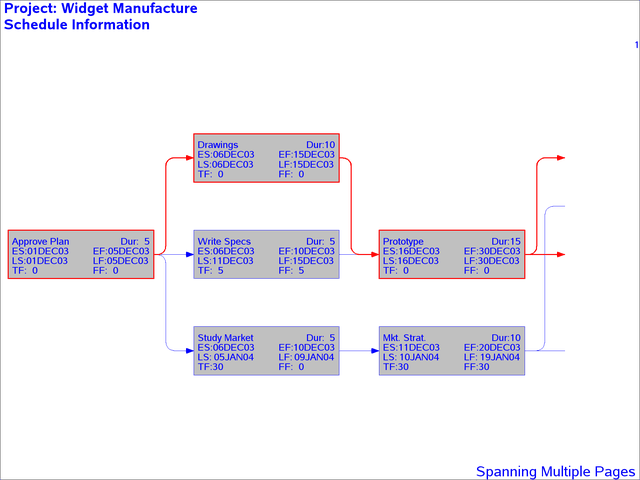
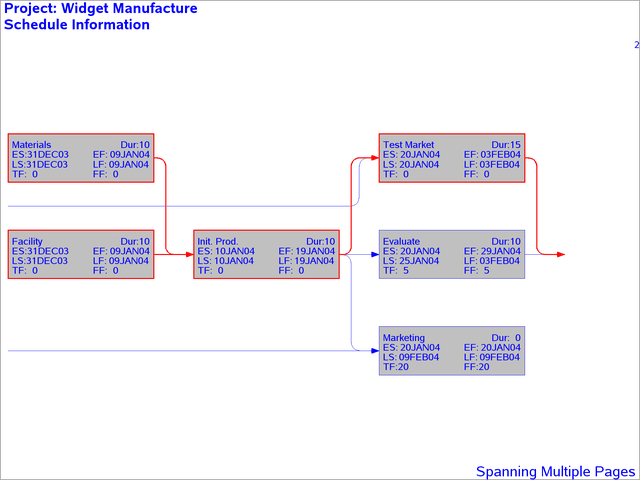
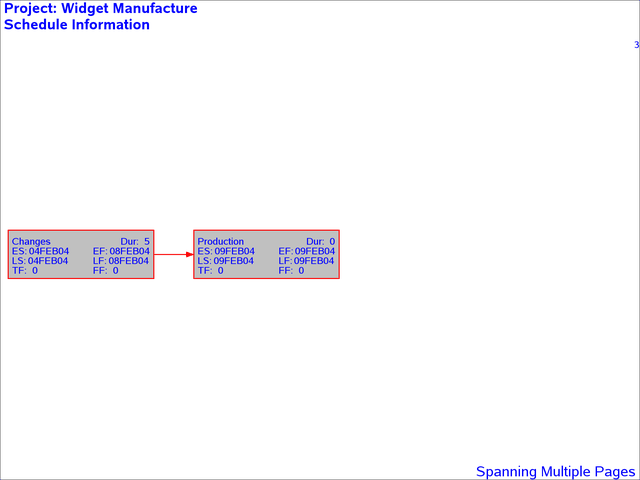
In this example, the Schedule data set produced by PROC CPM is displayed in a graphics network. As in the second part of Example 9.1, the procedure displays the duration as well as the early and late start and finish times and the total float and free float of each activity in the node corresponding to that activity. The network cannot fit on one page and is drawn across three pages, as shown in Output 9.3.1.
This example also illustrates several options for controlling the appearance of the network diagram. The pattern statements
set a background fill color for all the nodes of the network (PATTERN1 and PATTERN2). The COUTLINE= and CCRITOUT= options
set the outline colors for noncritical and critical activities, respectively. Recall that the procedure uses the values of
the E_FINISH and L_FINISH variables to determine if an activity is critical. The CARCS= and CCRITARCS= options color the regular arcs blue and the
critical arcs (arcs connecting critical activities) red, respectively and the CTEXT= options sets the color of the text to
blue. Finally, the LWIDTH= option sets the default width for all the lines in the network, and the LWCRIT= option further
highlights the critical arcs by drawing them with thicker lines.
In this invocation of PROC NETDRAW, the SEPARATEARCS option is used so that the two parallel arcs leading into the activity 'Test Market' (one from 'Mkt.Strat.' and the other from 'Init. Prod.') are drawn along separate tracks instead of along a single track as in Example 9.2.
 /* Activity-on-Node representation of the project */
data widget;
   format task $12. succ1-succ3 $12.;
   input task & days succ1 & succ2 & succ3 & ;
   datalines;
Approve Plan   5  Drawings      Study Market  Write Specs
Drawings      10  Prototype     .             .
Study Market   5  Mkt. Strat.   .             .
Write Specs    5  Prototype     .             .
Prototype     15  Materials     Facility      .
Mkt. Strat.   10  Test Market   Marketing     .
Materials     10  Init. Prod.   .             .
Facility      10  Init. Prod.   .             .
Init. Prod.   10  Test Market   Marketing     Evaluate
Evaluate      10  Changes       .             .
Test Market   15  Changes       .             .
Changes        5  Production    .             .
Production     0  .             .             .
Marketing      0  .             .             .
;
goptions hpos=80 vpos=50 border;
pattern1 c=ltgray v=s;
pattern2 c=ltgray v=s;

title c=blue j=l h=1.5 ' Project: Widget Manufacture';
title2 c=blue j=l h=1.5 ' Schedule Information';
footnote c=blue j=r h=1.5 'Spanning Multiple Pages ';
proc netdraw data=sched graphics;
   actnet / act=task
            succ=(succ1 succ2 succ3)
            dur = days
            coutline=blue
            ccritout=red
            carcs=blue
            ccritarcs=red
            ctext=blue
            lwidth=1
            lwcrit=2
            separatearcs;
   run;
Output 9.3.1: Project Schedule