The Earned Value Management Macros

Earned value refers to the amount of work that has been completed within a project to date. In Earned Value Management (EVM), this earned value is compared to the work that was planned, in order to measure project performance and to estimate future costs and project completion.
To see why an earned value analysis might be of interest, consider a four-week project with a planned completion cost of $10,000. After one week, the Planned Value (PV) is one quarter of $10,000, or $2,500. Assume that only $2,000 has been spent so far. This is the Actual Cost (AC). Also assume that only one fifth of the project has been completed. This gives an Earned Value (EV) of $2,000, which is one fifth of the original planned completion cost. The amount of work accomplished for the cost incurred is as expected, but the project is progressing more slowly than expected. In other words, the project is behind schedule, but within its budgetary constraints.
Based upon the performance of the project so far, EVA can be used to forecast the funds required to complete the project, and to predict the project completion date. Historically, earned value measurements have been found to be reliable indicators of future project performance as early as the 15 to 20 % completion point (see Fleming and Koppelman 2000).
The cost performance is good for the four-week project, so the project is still expected to cost $10,000 on completion. However, based on the schedule performance, the project duration is predicted to be five weeks instead of four weeks as originally planned. Additional estimates can provide upper and lower bounds on the project costs; these estimates are discussed in the section Getting Started: Earned Value Management Macros.
In this chapter two distinct sets of macros are described: one for analysis and one for reporting. The first set, consisting of the %EVA_PLANNED_VALUE, %EVA_EARNED_VALUE, %EVA_METRICS, and %EVA_TASK_METRICS macros, is used to analyze schedule and cost data and to derive earned value metrics. The second set, consisting of the %EVG_COST_PLOT, %EVG_SCHEDULE_PLOT, %EVG_INDEX_PLOT, %EVG_VARIANCE_PLOT, %EVG_GANTT_CHART and %EVG_WBS_CHART macros, is used to graphically represent the results from the first set.
Note: To use the graphical macros, SAS/GRAPH must be licensed.
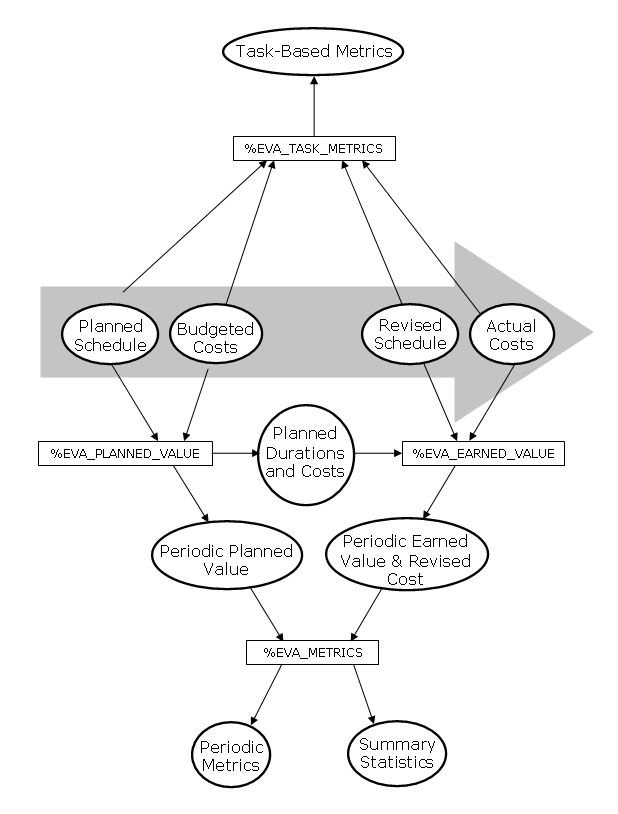
The %EVA_PLANNED_VALUE macro computes the periodic planned value for the project. The periodic planned value is the periodic cost that is to be incurred by the project and is derived from the planned schedule and costs, and the workday, calendar, and holiday data sets. (These inputs are provided by the user.) The costs associated with an activity can be incurred continuously and/or at discrete time points. Continuously incurred costs are modeled by specifying a cost rate. For discretely incurred costs, the cost of the activity can be apportioned at the beginning (100-0), at the end (0-100), both equally (50-50), or both asymmetrically (custom), as desired. In general, costs can be incurred at evenly distributed time points over the duration of the associated activity, according to the number of weights specified. This macro can be run at any time —before, during, or after project execution.
Once the project is under way and actual schedule and cost information is available, the %EVA_EARNED_VALUE macro can be invoked to produce the revised periodic cost, along with periodic earned value. The set of periodic costs produced by %EVA_PLANNED_VALUE and %EVA_EARNED_VALUE can then be used in the %EVA_METRICS macro to generate earned value performance measurements and summary statistics for one or more status dates. In addition, the %EVA_METRICS macro computes cumulative costs, indices, and variances.
The %EVA_TASK_METRICS macro produces task-based performance measurements including Cost and Schedule Variance (CV and SV, respectively) and Cost and Schedule Performance Index (CPI and SPI, respectively).
The flow of data through the analysis macros is illustrated in Figure 11.1. The large arrow indicates the passage of time between the planned schedule and budget and the updated schedule and budget.
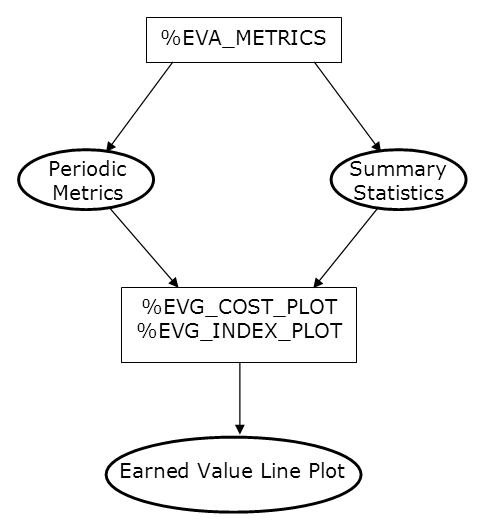
The first of the graphics macros are %EVG_COST_PLOT and %EVG_INDEX_PLOT. %EVG_COST_PLOT is used to produce line plots of planned value, earned value, actual cost, and revised cost over time, using the output from the %EVA_METRICS macro.
The %EVG_INDEX_PLOT macro displays line plots of the Cost and Schedule Performance Indices (CPI and SPI, respectively), also using the output from the %EVA_METRICS macro. The CPI is the earned value per actual cost and the SPI is the earned value per planned value. Figure 11.2 shows the data flow for the %EVG_INDEX_PLOT and the %EVG_COST_PLOT macros.
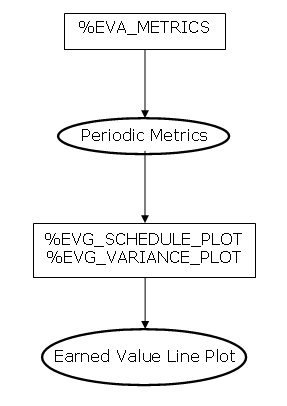
The %EVG_SCHEDULE_PLOT macro is a schedule-oriented version of %EVG_COST_PLOT. The plot produced by %EVG_SCHEDULE_PLOT shows an estimate for the end date of the project. This estimate is an extrapolation of the current earned value to the BAC (Budget at Completion).
%EVG_VARIANCE_PLOT uses the output from %EVA_METRICS to produce line plots for the project Cost and Schedule Variance over time. The CV is computed as the difference between the earned value and actual cost, whereas the SV is the difference between earned value and planned value. Figure 11.3 shows the data flow for the %EVG_SCHEDULE_PLOT and %EVG_VARIANCE_PLOT macros.
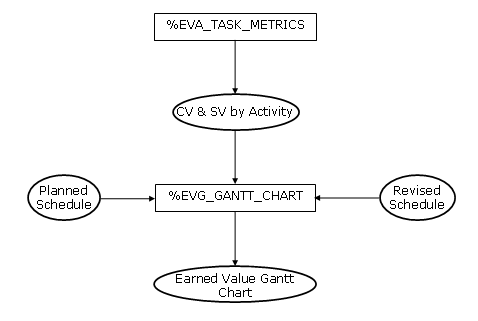
The %EVG_GANTT_CHART macro uses the planned and revised schedule and budget, along with the output from the %EVA_TASK_METRICS macro, to produce a Gantt chart of the project activities, along with the CV and SV for each activity. A pictorial description of the data flow is given in Figure 11.4.
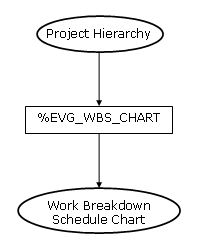
Finally, for multiprojects, or projects with a task/subtask hierarchy, the %EVG_WBS_CHART macro is used to display the Work Breakdown Structure. The input data set for this macro contains the activity, the project to which it belongs (or alternatively, the Work Breakdown Structure code), and any miscellaneous data for each activity that is to be carried into the graphical output. The data flow is shown in Figure 11.5.