The DTREE Procedure

This example illustrates the use of the SYMBOL and GOPTIONS statements for controlling the appearance of the decision tree diagram. It also uses the ANNOTATE= option to add a customized legend to the diagram.
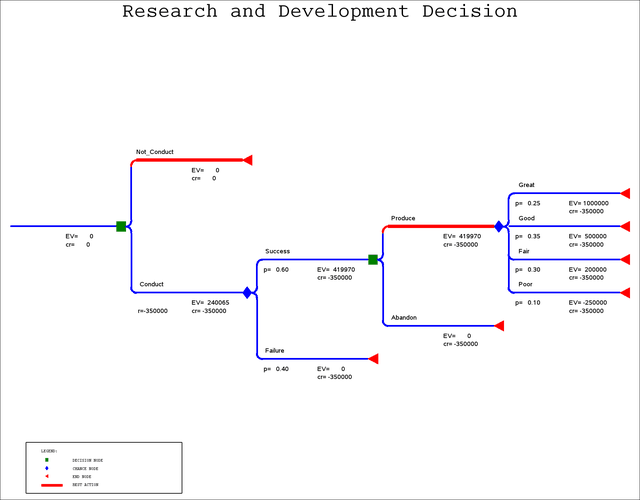
A typical problem encountered in a research and development setting involves two decisions: whether or not to conduct research, and whether or not to commercialize the results of that research. Suppose that research and development for a specific project will cost $350,000, and there is a 0.4 probability that it will fail. Also suppose that the different levels of market success and their corresponding probabilities are:
Table 7.23: Levels of Market Success and Their Probabilities
|
Market Success |
Net Return |
Probability |
|
Great |
$1,000,000 |
0.25 |
|
Good |
$500,000 |
0.35 |
|
Fair |
$200,000 |
0.30 |
|
Poor |
-$250,000 |
0.10 |
The structure of the model is represented in the STAGEIN=
data set Stage4.
/* -- create the STAGEIN= data set              -- */
data Stage4;
input _STNAME_ $ 1-16 _STTYPE_ $ 17-20
 _OUTCOM_ $ 21-32 _REWARD_ dollar12.0
 _SUCC_ $ 45-60;
datalines;
R_and_D         D   Not_Conduct .           .
.               .   Conduct     -$350,000   RD_Outcome
RD_Outcome      C   Success     .           Production
.               .   Failure     .           .
Production      D   Produce     .           Sales
.               .   Abandon     .           .
Sales           C   Great       .           .
.               .   Good        .           .
.               .   Fair        .           .
.               .   Poor        .           .
;
The probability distributions for the various outcomes of the chance stages are given in the PROBIN=
data set named Prob4.
/* -- create the PROBIN= data set               -- */
data Prob4;
input _EVENT1_ $ _PROB1_ _EVENT2_ $12. _PROB2_;
datalines;
Success     0.6     Failure   0.4
Great       0.25    Good      0.35
Fair        0.30    poor      0.1
;
The payoffs are given in the PAYOFFS=
data set Payoff4.
/* -- create the PAYOFFS= data set                   -- */
data Payoff4;
input _STATE_ $12. _VALUE_ dollar12.0;
datalines;
Great       $1,000,000
Good        $500,000
Fair        $200,000
Poor        -$250,000
;
The following DATA step builds a data set that contains the Annotate description of a legend. Refer to the chapter on the annotate facility in SAS/GRAPH Software: Reference for a description of the Annotate facility.
/* -- create the ANNOTATE= data set for legend     -- */
data Legend;
length FUNCTION $ 8;
length STYLE $ 16;
WHEN = 'B';  POSITION='0';
XSYS='4';  YSYS='4';
input FUNCTION $ X Y STYLE & 16. SIZE COLOR $ TEXT $ & 16.;
datalines;
move       8   2.1  .               .   .       .
draw      12   2.1  .               8   red     .
label     14   2    Cumberland AMT  0.6 black   BEST ACTION
symbol     9   3.5  marker          0.6 red     A
label     14   3.2  Cumberland AMT  0.6 black   END NODE
symbol     9   4.7  marker          0.6 blue    P
label     14   4.4  Cumberland AMT  0.6 black   CHANCE NODE
symbol     9   5.9  marker          0.6 green   U
label     14   5.6  Cumberland AMT  0.6 black   DECISION NODE
label      8   7.0  Cumberland AMT  0.6 black   LEGEND:
move       5   8.5  .               .   black   .
draw      35   8.5  .               2   black   .
draw      35   1    .               2   black   .
draw       5   1    .               2   black   .
draw       5   8.5  .               2   black   .
;
The following program invokes PROC DTREE, which evaluates the decision tree and plots it on a graphics device using the Annotate
data set Legend to draw the legend.
   /* define symbol characteristics for chance nodes and  */
   /* links except those that represent optimal decisions */
symbol1 f=marker h=1.8 v=P c=blue w=5 l=1;

   /* define symbol characteristics for decision nodes    */
   /* and links that represent optimal decisions          */
symbol2 f=marker h=1.8 v=U cv=green ci=red w=10 l=1;

   /* define symbol characteristics for end nodes         */
symbol3 f=marker h=1.8 v=A cv=red;

   /* define graphics options                             */
goptions htext=1.2;

   /* -- define title -- */
title f='Cumberland AMT'
h=2.5 'Research and Development Decision';

   /* -- PROC DTREE statements                          -- */
proc dtree
     stagein=Stage4 probin=Prob4 payoffs=Payoff4
     criterion=maxce rt=1800000
     graphics annotate=Legend nolg ;

   evaluate;

   treeplot / linka=1 linkb=2
              symbold=2 symbolc=1 symbole=3 compress name="dt4";

quit;
The SYMBOL1, SYMBOL2, and SYMBOL3 statements create three SYMBOL definitions that contain information for drawing nodes and
links. The Legend data set and the ANNOTATE=
option specified in the PROC DTREE
statement cause the procedure to produce a customized legend for the decision tree diagram. The LINKA=
, LINKB=
, SYMBOLD=
, SYMBOLC=
, and SYMBOLE=
specifications in the TREEPLOT
statement tell PROC DTREE how to use SYMBOL definitions to draw the decision tree. Table 7.24 describes the options in SYMBOL definitions used to draw the decision tree diagram.
The decision tree diagram produced by the TREEPLOT statement is shown in Output 7.4.1. As illustrated on the decision tree, the program recommends that one should not conduct the research and development of the product if he or she is risk averse with a risk tolerance of $1,800,000. However, if he or she decides to undertake the research and development and it is a success, then he or she should commercialize the product.
Table 7.24: The Usage of SYMBOL Definitions
|
SYMBOL Definition |
Specification |
Description |
Used to Draw |
|
The First |
C=blue |
Color |
All links except |
|
L=1 |
Line Type |
those that indicate |
|
|
W=3 |
Thickness |
optimal decisions |
|
|
C=blue |
Color |
Chance nodes |
|
|
F=marker |
Font |
||
|
H=2 |
Height |
||
|
V=P |
Symbol |
||
|
The Second |
CI=red |
Color |
All links that |
|
L=1 |
Line Type |
indicate optimal |
|
|
W=3 |
Thickness |
decisions |
|
|
CV=green |
Color |
Decision nodes |
|
|
F=marker |
Font |
||
|
H=2 |
Height |
||
|
V=U |
Symbol |
||
|
The Third |
CV=red |
Color |
End nodes |
|
F=marker |
Font |
||
|
H=2 |
Height |
||
|
V=A |
Symbol |