Example 3.5 Resource-Constrained Scheduling
The previous two examples illustrated some of the reports that can be generated using the Schedule output data set produced by PROC CPM. This section illustrates the use of PROC CPM to perform resource-constrained scheduling and to obtain a resource Usage output data set for generating reports of resource utilization during the course of a project. A primary concern in data processing centers is the number of processors needed to perform various tasks. Given a series of programming tasks, a common question faced by a data center operator is how to allocate computer resources to the various tasks.
Consider a simple job that involves sorting six data sets A, B, C, D, E, and F, merging the first three into one master data set, merging the last three into another comparison data set, and then comparing the two merged data sets. The precedence constraints between the activities (captured by the variables task and succ), the time required by the activities (the variable dur), and the resource required (the variable processor) are shown in the following code:
data program;
   format task $8. succ $8. ;
   input task & succ & dur processor;
   datalines;
Sort A    Merge 1    5   1
Sort B    Merge 1    4   1
Sort C    Merge 1    3   1
Sort D    Merge 2    6   1
Sort E    Merge 2    4   1
Sort F    Merge 2    6   1
Merge 1   Compare    5   1
Merge 2   Compare    4   1
Compare   .          5   1
;
If the programming project is scheduled (in absolute units) without any resource constraints, it will take 15 time units for completion and will require a maximum availability of six processors. Suppose now that only two processors are available. The resin data set limits the availability of the resource to 2, and PROC CPM is invoked with two input data sets (Activity data set program and Resource data set resin) to produce a resource-constrained schedule.
PROC CPM produces two output data sets. The Schedule data set (progschd) contains the resource-constrained schedule (S_START and S_FINISH variables) in addition to the early and late start unconstrained schedules. The Usage data set (progrout) shows the number of processors required at every unit of time, if the early start schedule or the late start schedule or the resource-constrained schedule were followed, in the variables eprocessor, lprocessor, and rprocessor, respectively; the variable aprocessor shows the number of processors remaining after resource allocation. The two output data sets are displayed in Output 3.5.1.
data resin;
   input per processor;
   datalines;
0  2
;
proc cpm data=program resin=resin
         out=progschd resout=progrout;
   activity  task;
   duration  dur;
   successor succ;
   resource  processor/per=per;
   run;

title 'Scheduling Programming Tasks';
title2 'Data Set PROGSCHD';
proc print data=progschd;
   run;

title2 'Data Set PROGROUT';
proc print data=progrout;
   run;
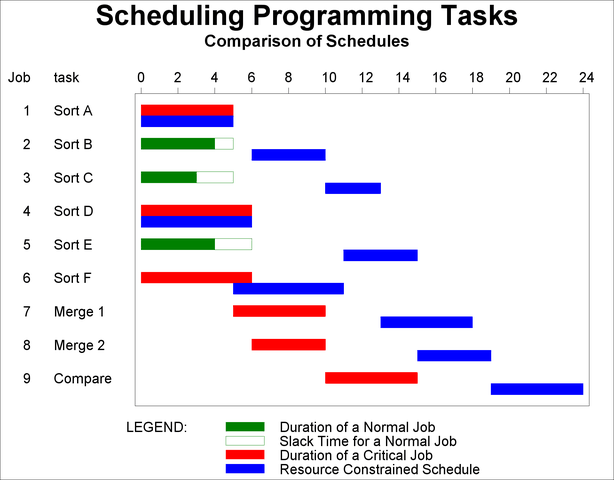
The Schedule and Usage data sets, displayed in Output 3.5.1, can be used to generate any type of report concerning the schedules or processor usage. In the following program, the unconstrained and constrained schedules are first plotted using PROC GANTT (see Output 3.5.2).
| Scheduling Programming Tasks |
| Data Set PROGSCHD |
| Obs | task | succ | dur | processor | S_START | S_FINISH | E_START | E_FINISH | L_START | L_FINISH |
|---|---|---|---|---|---|---|---|---|---|---|
| 1 | Sort A | Merge 1 | 5 | 1 | 0 | 5 | 0 | 5 | 0 | 5 |
| 2 | Sort B | Merge 1 | 4 | 1 | 6 | 10 | 0 | 4 | 1 | 5 |
| 3 | Sort C | Merge 1 | 3 | 1 | 10 | 13 | 0 | 3 | 2 | 5 |
| 4 | Sort D | Merge 2 | 6 | 1 | 0 | 6 | 0 | 6 | 0 | 6 |
| 5 | Sort E | Merge 2 | 4 | 1 | 11 | 15 | 0 | 4 | 2 | 6 |
| 6 | Sort F | Merge 2 | 6 | 1 | 5 | 11 | 0 | 6 | 0 | 6 |
| 7 | Merge 1 | Compare | 5 | 1 | 13 | 18 | 5 | 10 | 5 | 10 |
| 8 | Merge 2 | Compare | 4 | 1 | 15 | 19 | 6 | 10 | 6 | 10 |
| 9 | Compare | 5 | 1 | 19 | 24 | 10 | 15 | 10 | 15 |
| Scheduling Programming Tasks |
| Data Set PROGROUT |
| Obs | _TIME_ | Eprocessor | Lprocessor | Rprocessor | Aprocessor |
|---|---|---|---|---|---|
| 1 | 0 | 6 | 3 | 2 | 0 |
| 2 | 1 | 6 | 4 | 2 | 0 |
| 3 | 2 | 6 | 6 | 2 | 0 |
| 4 | 3 | 5 | 6 | 2 | 0 |
| 5 | 4 | 3 | 6 | 2 | 0 |
| 6 | 5 | 3 | 4 | 2 | 0 |
| 7 | 6 | 2 | 2 | 2 | 0 |
| 8 | 7 | 2 | 2 | 2 | 0 |
| 9 | 8 | 2 | 2 | 2 | 0 |
| 10 | 9 | 2 | 2 | 2 | 0 |
| 11 | 10 | 1 | 1 | 2 | 0 |
| 12 | 11 | 1 | 1 | 2 | 0 |
| 13 | 12 | 1 | 1 | 2 | 0 |
| 14 | 13 | 1 | 1 | 2 | 0 |
| 15 | 14 | 1 | 1 | 2 | 0 |
| 16 | 15 | 0 | 0 | 2 | 0 |
| 17 | 16 | 0 | 0 | 2 | 0 |
| 18 | 17 | 0 | 0 | 2 | 0 |
| 19 | 18 | 0 | 0 | 1 | 1 |
| 20 | 19 | 0 | 0 | 1 | 1 |
| 21 | 20 | 0 | 0 | 1 | 1 |
| 22 | 21 | 0 | 0 | 1 | 1 |
| 23 | 22 | 0 | 0 | 1 | 1 |
| 24 | 23 | 0 | 0 | 1 | 1 |
| 25 | 24 | 0 | 0 | 0 | 2 |
goptions hpos=80 vpos=43;

title h=2.5 'Scheduling Programming Tasks';
title2 h=1.5 'Comparison of Schedules';
proc gantt data=progschd graphics;
   chart / height=1.5 increment=2 caxis=black;
   id task;
   run;
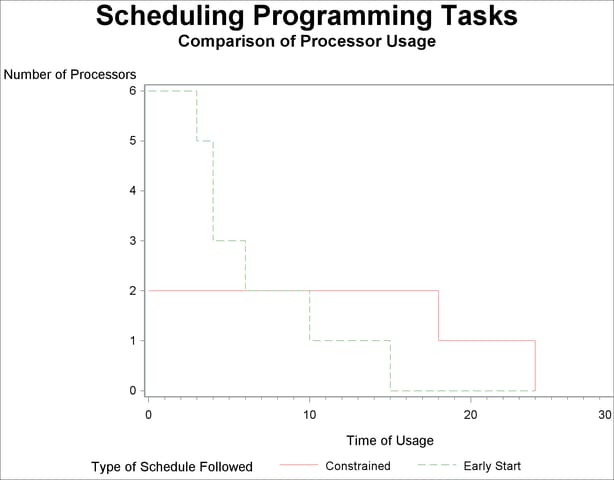
Next, the GPLOT procedure is invoked using the Usage data set to compare the unconstrained and the constrained usage of the resource (see Output 3.5.3).
/* Create a data set for use with PROC GPLOT */
data plotout;
   set progrout;
   label _time_='Time of Usage';
   label processor='Number of Processors';
   label resource='Type of Schedule Followed';
   resource='Constrained';
   processor=rprocessor; output;
   resource='Early Start';
   processor=eprocessor; output;
   run;
axis1 minor=none width=3;
axis2 length=80 pct;
symbol1 i=steplj c=red;
symbol2 i=steplj l=3 c=green;

title2 h=1.5 'Comparison of Processor Usage';
proc gplot data=plotout;
   plot processor * _time_ = resource/ vaxis=axis1
                                       haxis=axis2
                                       caxis=black;
   run;