Example 3.4 Summary Report
As mentioned in the section Data Flow, the output data set can be manipulated in several different ways. You can subset the project data to report progress on selected activities, or you can produce reports sorted by a particular field or grouped according to a natural division of the project activities. For large projects, you may want to get a summarized view of the schedule, with the start and finish times of only the major phases of the project.
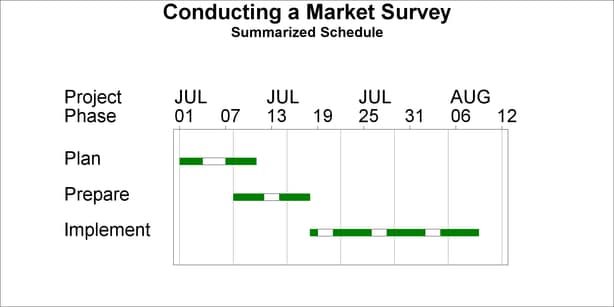
For the survey project, suppose that you want a condensed report, containing only information about the start and finish times of the three different phases of the project. The following program summarizes the information in the data set survschd and produces a Gantt chart of the summarized schedule (shown in Output 3.4.1).
proc sort data=survschd;
   by phase;
   run;

proc summary data=survschd;
   by phase;
   output out=sumsched min(e_start)= max(e_finish)= ;
   var e_start e_finish;
   run;

proc sort data=sumsched;
   by e_start;
   format e_start e_finish date7.;
   run;

pattern1 c=green v=s;
pattern2 c=green v=e;
pattern3 c=red   v=s;
pattern4 c=magenta v=e;
pattern5 c=magenta v=s;
pattern6 c=cyan v=s;
pattern7 c=black v=e;

goptions hpos=80 vpos=43;

title c=black h=3 'Conducting a Market Survey';
title2 c=black h=2 'Summarized Schedule';

proc gantt data=sumsched graphics
     holidata=holidata;
   id phase;
   chart / nojobnum
           nolegend
           interval=weekday
           height=2.0 skip=4
           ref='01jul03'd to '15aug03'd by week
           caxis=black
           cref=gray
           holiday=(hol);
   run;