The DTREE Procedure

| Evaluation |
The EVALUATE statement causes PROC DTREE to calculate the optimal decision. The evaluate process is done by successive use of two devices:
Find a certain equivalent for the uncertain evaluating values at each chance node.
Choose the best alternative at each decision node.
The certain equivalent of an uncertainty is the certain amount you would accept in exchange for the uncertain venture. In other words, it is a single number that characterizes an uncertainty described by a probability distribution. This value is subjective and can vary widely from person to person. There are two quantities, closely related to the certain equivalent, that are commonly used by decision-makers: the most likely value and the expected value. The most likely value of an uncertainty is the value with the largest probability. The expected value is the sum of all outcomes multiplied by their probabilities.
Perhaps the most popular way to find the certain equivalent for an uncertainty is the use of utility function or utility curve. Utility is a measurement of relative preference to the decision maker for particular outcomes. The utility function assigns a utility to payoff when it is in terms of continuous values such as money. The certain equivalent of an uncertainty (a random variable) is calculated by the following steps:
Use the utility function or the utility curve to find the utility values of the outcomes.
Calculate the expected utility of the uncertainty.
Determine the certain equivalent of the uncertainty as the value that corresponding utility value is the expected utility.
Refer to Raiffa (1970) for a complete discussion of the utility function.
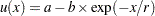
A simple case that is commonly used is the straight line utility curve or the linear utility function. The linear utility function has the form
 |
where  is the evaluating value, and
  and
and  are parameters set by the choice of two points in the utility curve. For example, if the utility curve passes two points
  and
and  , then parameters and are set by
  and
and  . The certain equivalent of an uncertainty based on this function is the expected value.
Another special case that is commonly used is the exponential utility function, as
 |
where, again, and can be set by the choice of two arbitrary points in the utility curve. For example, if your utility curve goes through points  and
and  , then and are given by
 |
If an uncertain venture  has
has  events, event
  having probability
  and payoff
  , and if the utility function is an exponential function as in the preceding example, then the certain equivalent of is
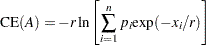 |
and is independent of the choice of values for and (provided that  ) (Raiffa 1970).
The parameter  , called the risk tolerance, describes the curvature of the utility function. Moreover, the quantity
  , called risk aversion coefficient (Howard 1968) is a measure of risk aversion.
Experimental results show that within a reasonable range of values, many utility curves can be fit quite well by an exponential function.
If your utility function is an exponential function as in the preceding example, the risk tolerance can be estimated by the largest number  for which the following venture is still acceptable to you.
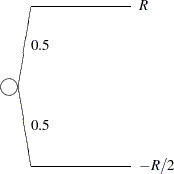
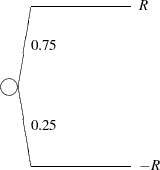
A similar way to approximate the risk tolerance is to find the largest value for which the venture is acceptable (Howard 1988).
For corporate decision making, there are some rules of thumb for estimating the risk tolerance. Examples are to set risk tolerance about equal to one of the following:
net income of the company
one sixth of equity
six percent of net sales
To reveal how well these rules perform in assessing corporate risk tolerance, Howard (1988) provided the following two tables: Table 7.12 shows the relationship between the risk tolerance and financial measures of four large oil and chemicals companies. There, the risk tolerances are obtained from the top executives of the companies. The net sales, net income, and equity are obtained from the annual reports of the four companies.
Measure |
Company |
|||
|---|---|---|---|---|
($ millions) |
A |
B |
C |
D |
Net Sales |
|
|
|
|
Net Income |
|
|
|
|
Equity |
|
|
|
|
Risk Tolerance |
|
|
|
|


Table 7.13 shows the ratio of risk tolerance to each of the other quantities.
Company |
|||||
Measure |
A |
B |
C |
D |
Average |
RT/Sales |
|
|
|
|
|
RT/Income |
|
|
|
|
|
RT/Equity |
|
|
|
|
|


Once the certain equivalents for all chance nodes are assessed, the choice process at each decision node is fairly simple; select the alternative yielding either the maximum or the minimum (depending on the problem) future certain equivalent value. You can use the CRITERION= option to control the way the certain equivalent is calculated for each chance node and the optimal alternative is chosen at each decision node. Possible values for the CRITERION= option are listed in Table 7.5. If you use an exponential utility function, the RT= option can be used to specify your risk tolerance. You also have control over how to present the solution. By default, PROC DTREE writes the value of the optimal decisions to the SAS log. In addition, with the SUMMARY option, you can ask PROC DTREE to display the optimal decision summary to the output.