| The GANTT Procedure |
Example 8.24 Multisegment Gantt Charts
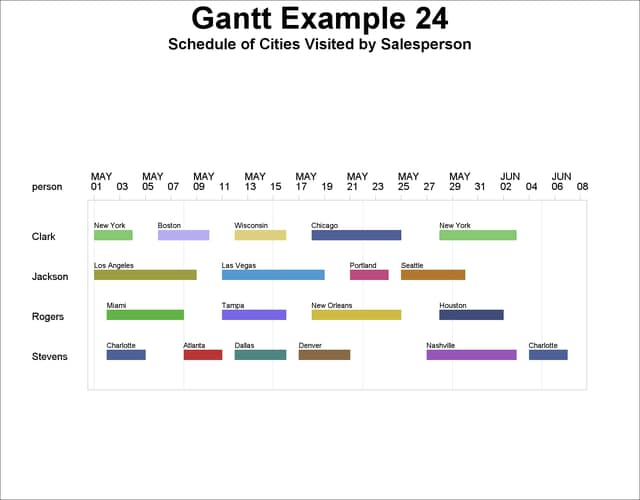
The following is a simple example that illustrates the generation of multisegmented Gantt charts. The SCHED data set identifies the city, the arrival time, and the departure time for each of four traveling salespeople. In addition, a _PATTERN variable is used to identify the pattern to be used for drawing the bar. The objective is to display the complete schedule for each sales person on a single row. This would require displaying several bars on a single row, each bar corresponding to the time spent in a city. In order to do this, you need first to sort the SCHED data set by Salesperson and Arrival Time and then to add a SEGMT_NO variable that identifies the number of the segment that, in this case, is the order in which the salesperson visits the city. The resulting data set, NEWSCHED, is shown in Output 8.24.1. You next create the LABELS data set in order to identify the names of the cities above the bars; the resulting Gantt chart is shown in Output 8.24.2.
Notice that each bar is drawn using the pattern identified by the _PATTERN variable in the SCHED data set. In the absence of the _PATTERN variable, the pattern associated with the resource-constrained schedule would have been used for all the bars. This is the same mechanism that produced the split segments in Example 8.13 although the SEGMT_NO variable in this case was automatically created by the CPM procedure.
data sched;
   format city $12. from to date7. ;
   input person $ city & from & date7. to & date7. _pattern;
   datalines;
Clark   New York     01May04  03May04  10
Clark   Boston       06May04  09May04  11
Clark   Wisconsin    12May04  15May04  12
Clark   Chicago      18May04  24May04  13
Clark   New York     28May04  02Jun04  10
Stevens Charlotte    02May04  04May04  14
Stevens Atlanta      08May04  10May04  15
Stevens Dallas       12May04  15May04  16
Stevens Denver       17May04  20May04  17
Stevens Nashville    27May04  02Jun04  18
Stevens Charlotte    04Jun04  06Jun04  14
Jackson Los Angeles  01May04  08May04  19
Jackson Las Vegas    11May04  18May04  20
Jackson Portland     21May04  23May04  21
Jackson Seattle      25May04  29May04  22
Rogers  Miami        02May04  07May04  23
Rogers  Tampa        11May04  15May04  24
Rogers  New Orleans  18May04  24May04  25
Rogers  Houston      28May04  01Jun04  26
;
 /* Sort data by person, from */
proc sort data=sched;
   by person from;
   run;
/* Add Segmt_no variable */
data newsched;
   set sched;
   retain segmt_no;
   if person ne lag(person) then segmt_no=1;
   else segmt_no = segmt_no + 1;
   output;
   run;
proc print data=newsched;
   title2 'Data NEWSCHED';
   run;
data labels;
   _y=-1;
   _lvar="city";
   _xvar="from";
   _flabel="";
   _hlabel=0.75;
   _yoffset = -.2;
   run;
* set up required pattern statements;
pattern1 v=s r=25;

title1 'Gantt Example 24';
title2 'Schedule of Cities Visited by Salesperson';
proc gantt graphics data=newsched labdata=labels;
id person;
chart / ss=from sf=to compress labsplit='.' scale=2
        nolegend nojobnum skip=3
        ref='01may04'd to '30jun04'd by week;
run;
| Data NEWSCHED |
| Obs | city | from | to | person | _pattern | segmt_no |
|---|---|---|---|---|---|---|
| 1 | New York | 01MAY04 | 03MAY04 | Clark | 10 | 1 |
| 2 | Boston | 06MAY04 | 09MAY04 | Clark | 11 | 2 |
| 3 | Wisconsin | 12MAY04 | 15MAY04 | Clark | 12 | 3 |
| 4 | Chicago | 18MAY04 | 24MAY04 | Clark | 13 | 4 |
| 5 | New York | 28MAY04 | 02JUN04 | Clark | 10 | 5 |
| 6 | Los Angeles | 01MAY04 | 08MAY04 | Jackson | 19 | 1 |
| 7 | Las Vegas | 11MAY04 | 18MAY04 | Jackson | 20 | 2 |
| 8 | Portland | 21MAY04 | 23MAY04 | Jackson | 21 | 3 |
| 9 | Seattle | 25MAY04 | 29MAY04 | Jackson | 22 | 4 |
| 10 | Miami | 02MAY04 | 07MAY04 | Rogers | 23 | 1 |
| 11 | Tampa | 11MAY04 | 15MAY04 | Rogers | 24 | 2 |
| 12 | New Orleans | 18MAY04 | 24MAY04 | Rogers | 25 | 3 |
| 13 | Houston | 28MAY04 | 01JUN04 | Rogers | 26 | 4 |
| 14 | Charlotte | 02MAY04 | 04MAY04 | Stevens | 14 | 1 |
| 15 | Atlanta | 08MAY04 | 10MAY04 | Stevens | 15 | 2 |
| 16 | Dallas | 12MAY04 | 15MAY04 | Stevens | 16 | 3 |
| 17 | Denver | 17MAY04 | 20MAY04 | Stevens | 17 | 4 |
| 18 | Nashville | 27MAY04 | 02JUN04 | Stevens | 18 | 5 |
| 19 | Charlotte | 04JUN04 | 06JUN04 | Stevens | 14 | 6 |
Copyright © SAS Institute, Inc. All Rights Reserved.