| The GANTT Procedure |
Example 8.13 Plotting the Resource-Constrained Schedule
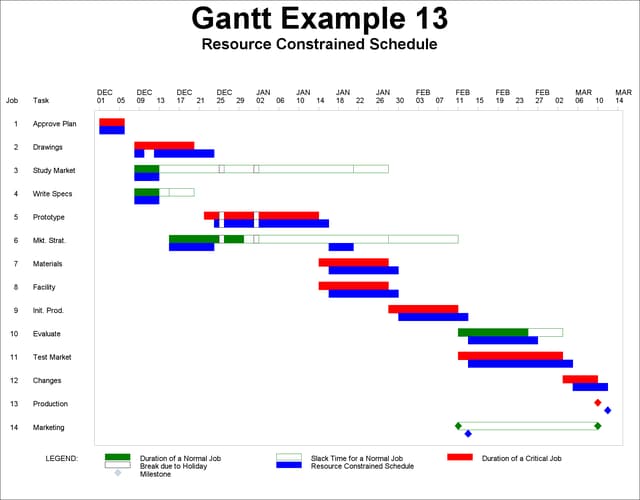
This example illustrates plotting the resource-constrained schedules on a Gantt chart. The schedule used is the one produced in Example 2.19 using the CPM procedure. The output data set from PROC CPM is displayed in Output 8.13.2. Notice that the activities 'Drawings' and 'Mkt. Strat.' have been split to produce a shorter project duration than if they had not been split.
PROC GANTT is invoked with all default options and an ID statement. The early/late schedule is drawn on the first bar, and the resource-constrained schedule is drawn on the second bar of each activity. The observations corresponding to the split segments of each activity have been combined to produce the plot of the resource-constrained schedule for that activity. Thus, even though the Schedule data set input to PROC GANTT contains 18 observations, the Gantt chart shows each of the 14 activities only once.
title 'Gantt Example 13';
title2 'Resource Constrained Schedule';

* set vpos to 50 and hpos to 100;
goptions vpos=50 hpos=100;


* plot the resource-constrained schedule using proc gantt;
proc gantt data=spltschd holidata=holdata;
   chart / holiday=(hol) dur=days
           pcompress;
   id task;
   run;
| Gantt Example 13 |
| Project Schedule: Splitting Allowed |
| Obs | Task | succ | SEGMT_NO | days | prodman | hrdware | S_START | S_FINISH | E_START | E_FINISH | L_START | L_FINISH |
|---|---|---|---|---|---|---|---|---|---|---|---|---|
| 1 | Approve Plan | Drawings | . | 5 | 1 | . | 01DEC03 | 05DEC03 | 01DEC03 | 05DEC03 | 01DEC03 | 05DEC03 |
| 2 | Drawings | Prototype | . | 10 | . | 1 | 08DEC03 | 23DEC03 | 08DEC03 | 19DEC03 | 08DEC03 | 19DEC03 |
| 3 | Drawings | Prototype | 1 | 2 | . | 1 | 08DEC03 | 09DEC03 | 08DEC03 | 19DEC03 | 08DEC03 | 19DEC03 |
| 4 | Drawings | Prototype | 2 | 8 | . | 1 | 12DEC03 | 23DEC03 | 08DEC03 | 19DEC03 | 08DEC03 | 19DEC03 |
| 5 | Study Market | Mkt. Strat. | . | 5 | . | . | 08DEC03 | 12DEC03 | 08DEC03 | 12DEC03 | 21JAN04 | 27JAN04 |
| 6 | Write Specs | Prototype | . | 5 | . | . | 08DEC03 | 12DEC03 | 08DEC03 | 12DEC03 | 15DEC03 | 19DEC03 |
| 7 | Prototype | Materials | . | 15 | 1 | . | 24DEC03 | 15JAN04 | 22DEC03 | 13JAN04 | 22DEC03 | 13JAN04 |
| 8 | Mkt. Strat. | Test Market | . | 10 | 1 | . | 15DEC03 | 20JAN04 | 15DEC03 | 29DEC03 | 28JAN04 | 10FEB04 |
| 9 | Mkt. Strat. | Test Market | 1 | 7 | 1 | . | 15DEC03 | 23DEC03 | 15DEC03 | 29DEC03 | 28JAN04 | 10FEB04 |
| 10 | Mkt. Strat. | Test Market | 2 | 3 | 1 | . | 16JAN04 | 20JAN04 | 15DEC03 | 29DEC03 | 28JAN04 | 10FEB04 |
| 11 | Materials | Init. Prod. | . | 10 | . | . | 16JAN04 | 29JAN04 | 14JAN04 | 27JAN04 | 14JAN04 | 27JAN04 |
| 12 | Facility | Init. Prod. | . | 10 | . | . | 16JAN04 | 29JAN04 | 14JAN04 | 27JAN04 | 14JAN04 | 27JAN04 |
| 13 | Init. Prod. | Test Market | . | 10 | 1 | . | 30JAN04 | 12FEB04 | 28JAN04 | 10FEB04 | 28JAN04 | 10FEB04 |
| 14 | Evaluate | Changes | . | 10 | 1 | . | 13FEB04 | 26FEB04 | 11FEB04 | 24FEB04 | 18FEB04 | 02MAR04 |
| 15 | Test Market | Changes | . | 15 | . | . | 13FEB04 | 04MAR04 | 11FEB04 | 02MAR04 | 11FEB04 | 02MAR04 |
| 16 | Changes | Production | . | 5 | . | . | 05MAR04 | 11MAR04 | 03MAR04 | 09MAR04 | 03MAR04 | 09MAR04 |
| 17 | Production | . | 0 | 1 | . | 12MAR04 | 12MAR04 | 10MAR04 | 10MAR04 | 10MAR04 | 10MAR04 | |
| 18 | Marketing | . | 0 | . | . | 13FEB04 | 13FEB04 | 11FEB04 | 11FEB04 | 10MAR04 | 10MAR04 |
Copyright © SAS Institute, Inc. All Rights Reserved.