| The Projman Application |
Network Diagram Options Window
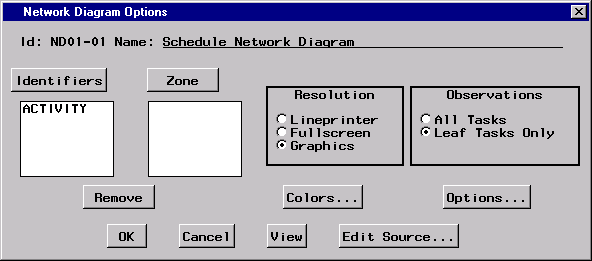
This window provides access to the settings and options available for network diagram reports. By changing values in this window, you can create and customize reports to meet your specific needs. Note that some options may be unavailable if the active project does not contain the appropriate data. Also, if data unique to a specific project are required by a report, that report may fail when generated for a different project.
Note that reports can be generated and viewed to verify the results before any changes are saved. Access to the source code is also provided.
For a description of standard report options, see the section "Standard Options".
|
Zone
When the Zone button is clicked, a window is opened to enable you to select a Zone variable. The selection is displayed on the window. The Zone variable can be removed by selecting the variable and clicking the Remove button.Zone Variable
The Zone variable is used to divide the network diagram into horizontal bands or zones corresponding to the distinct values of the variable. Most projects have at least one natural classification of the different activities in the project: department, type of work involved, location of the activity, and so on. By specifying a Zone variable, you can use this classification to subdivide the network diagram. The zones are automatically labeled with the Zone variable values and are separated by dividing lines. Click the Zone button to select a Zone variable.Remove
When this button is clicked, highlighted selections in the Identifier and Zone lists are deleted.Resolution
This option is used to specify the resolution of the network diagram report. The report can be produced with either lineprinter, fullscreen, or graphics-quality resolution.Observations
This option is used to specify which observations are used to produce the network diagram. For hierarchical projects, selecting Leaf Tasks Only means that only the lowest level tasks appear in the network diagram. When All Tasks is selected, all tasks (regardless of their hierarchical relationship) appear in the network diagram as separate nodes.Colors
By clicking this button, you can access a window containing color options for the network diagram report. These options are used to control the colors of different portions of the network diagram. Note that these options are ignored unless the Resolution option is set to produce a graphics-quality report.Options
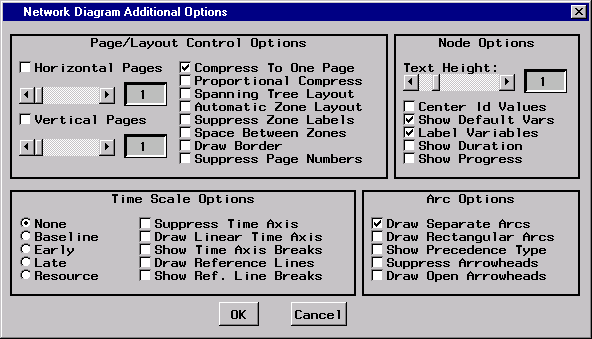
By clicking this button, you can access a window containing additional options for the network diagram report.
|
Page/Layout Control Options
Node Options
Time Scale Options
Arc Options
Color Options
Copyright © 2008 by SAS Institute Inc., Cary, NC, USA. All rights reserved.