| The NETDRAW Procedure |
Example 7.11: Zoned Network Diagram
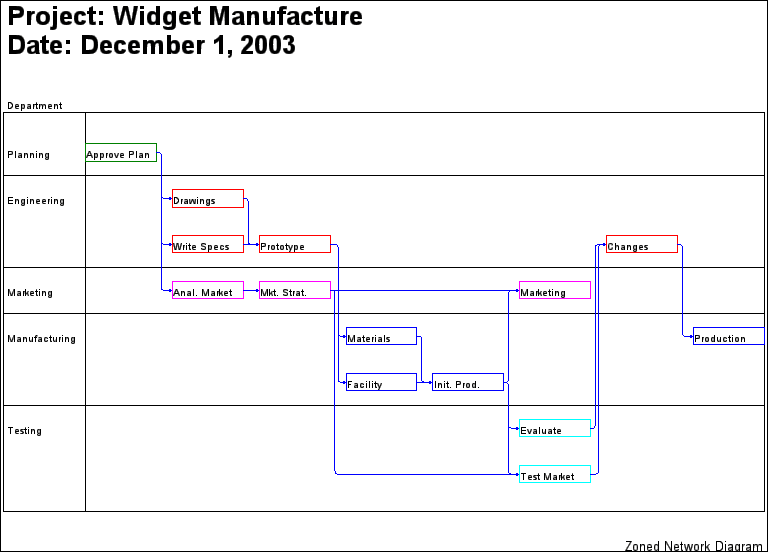
This example illustrates zoned network diagrams. The Widget Manufacturing project is used to illustrate some aspects of this feature. The data set DETAILS contains a variable phase, which identifies the phase of each activity in the project. This data set is merged with the Activity data set from Example 7.1, WIDGET, to produce the data set NETWORK that is input to PROC NETDRAW. The ZONE= option divides the network diagram into horizontal zones based on the project phase. The ZONEPAT option causes the activities in each zone to be drawn using a different pattern. The resulting network diagram is shown in Output 7.11.1.
    data details;
       format task $12. phase $13. descrpt $30. ;
       input task & phase $ descrpt & ;
       datalines;
    Approve Plan  Planning       Develop Concept
    Drawings      Engineering    Prepare Drawings
    Anal. Market  Marketing      Analyze Potential Markets
    Write Specs   Engineering    Write Specifications
    Prototype     Engineering    Build Prototype
    Mkt. Strat.   Marketing      Develop Marketing Concept
    Materials     Manufacturing  Procure Raw Materials
    Facility      Manufacturing  Prepare Manufacturing Facility
    Init. Prod.   Manufacturing  Initial Production Run
    Evaluate      Testing        Evaluate Product In-House
    Test Market   Testing        Test Product in Sample Market
    Changes       Engineering    Engineering Changes
    Production    Manufacturing  Begin Full Scale Production
    Marketing     Marketing      Begin Full Scale Marketing
    ;
    data network;
       merge widget details;
       run;

    pattern1 v=e c=green;
    pattern2 v=e c=red;
    pattern3 v=e c=magenta;
    pattern4 v=e c=blue;
    pattern5 v=e c=cyan;

    title  j=l h=1.5 ' Project: Widget Manufacture';
    title2 j=l h=1.5 ' Date: December 1, 2003';
    footnote j=r 'Zoned Network Diagram ';
    proc netdraw data=network graphics;
       actnet / act=task
                succ=(succ1 succ2 succ3)
                separatearcs
                zone=phase zonepat
                pcompress htext=2;
       label phase = 'Department';
       run;
Output 7.11.1: Zoned Network Diagram
|
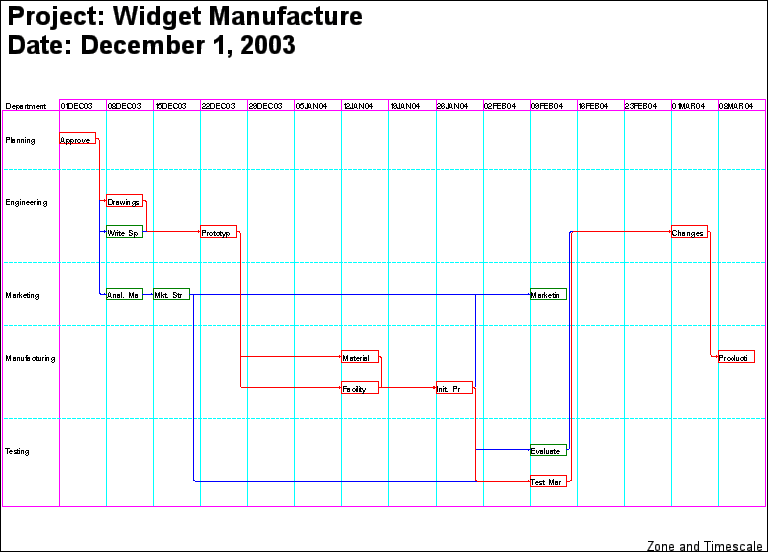
Next, the project is scheduled with PROC CPM, and PROC NETDRAW is invoked with the ZONE= and TIMESCALE options. The nodes are placed in different zones as dictated by the ZONE variable, phase, and are aligned along the time axis as dictated by the default ALIGN variable, E_START. The MININTERVAL= option produces one tick mark per week for the duration of the project. The LREF= option identifies the linestyle of the reference lines and the dividing lines between zones. The nodes are colored red or green according to whether or not the corresponding activities are critical (PATTERN statements 1 and 2 from the previous invocation of PROC NETDRAW are still valid).
    proc cpm data=network interval=weekday
             out=sched date='1dec03'd;
       activity task;
       succ     succ1 succ2 succ3;
       duration days;
       id phase;
       run;

    footnote j=r 'Zone and Timescale ';
    proc netdraw data=sched graphics;
       actnet / act=task succ=(succ1 succ2 succ3)
                pcompress
                font = swiss
                carcs = blue ccritarcs = red
                cref = cyan
                caxis = magenta
                lref = 33
                id = (task)
                nodefid
                nolabel
                boxwidth = 8
                htext=2
                separatearcs
                timescale
                mininterval=week
                autoref
                linear
                zone=phase
                zonespace;
       label phase = 'Department';
       run;
Output 7.11.2: Zoned Network Diagram with Time Axis
|
Copyright © 2008 by SAS Institute Inc., Cary, NC, USA. All rights reserved.