| The NETDRAW Procedure |
Example 7.10: Further Time-Scale Options
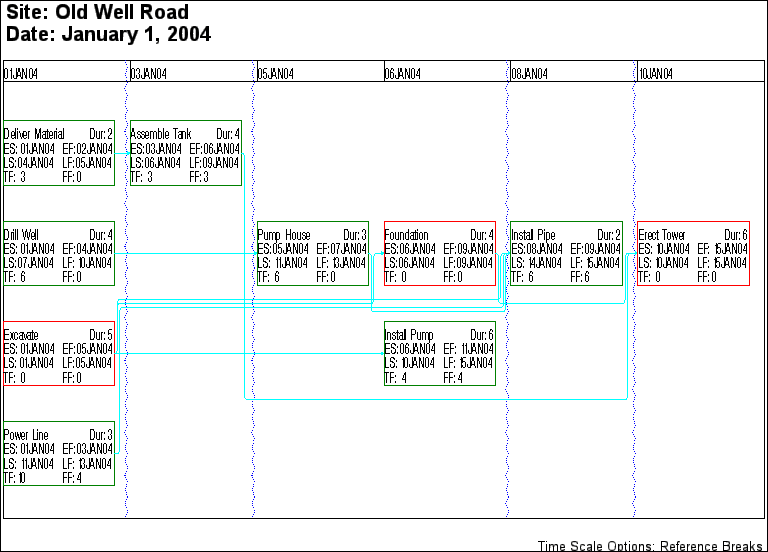
In this example, the construction project described in Example 7.7 is used to illustrate some more time-scale options. First, the REFBREAK option indicates breaks in the time axis by drawing a zigzag line down the diagram before each tick mark corresponding to a break. The CREFBRK= and LREFBRK= options control the color and line style for these lines. The network diagram is shown in Output 7.10.1.
    title  j=l h=1.5 ' Site: Old Well Road';
    title2 j=l h=1.5 ' Date: January 1, 2004';
    footnote j=r 'Time Scale Options: Reference Breaks ';

    proc netdraw data=sched graphics;
       actnet / act = task font=swiss
                dur = duration
                succ = (succesr1-succesr3)
                dp compress separatearcs
                htext=2
                timescale refbreak lrefbrk = 33
                carcs = cyan crefbrk = blue;
       run;
Output 7.10.1: Time-Scaled Network: Reference Breaks
|
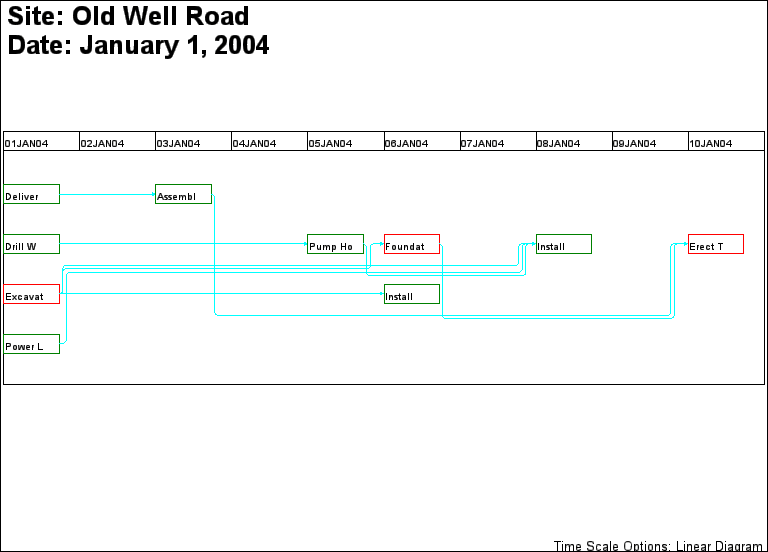
Next, PROC NETDRAW is invoked with the LINEAR option so that there is no break in the time axis. The BOXWIDTH= option limits the size of each node. The diagram is drawn in Output 7.10.2.
    footnote j=r 'Time Scale Options: Linear Diagram ';

    proc netdraw data=sched graphics;
       actnet / act = task font=swiss
                dur = duration
                succ = (succesr1-succesr3)
                dp
                pcompress
                novcenter
                vmargin = 10
                separatearcs
                htext=2
                carcs=cyan
                id=(task)
                nodefid
                nolabel
                boxwidth=7
                timescale
                linear
                frame;
       run;
|
Copyright © 2008 by SAS Institute Inc., Cary, NC, USA. All rights reserved.