| The Earned Value Management Macros |
Example 9.2: Construction Project
This example illustrates a home building multiproject.
The cost structure of the multiproject consists of both rates and
fixed costs. This example also demonstrates how to accommodate multiple status dates.
The initial schedule is shown in Figure 9.2.1.
Output 9.2.1: Initial Schedule GBSCHED
| Build House |
0 |
1 |
04SEP04 |
12OCT04 |
| Landscaping |
0.00 |
1 |
29SEP04 |
10OCT04 |
| Finish Grading |
0.00.0 |
2 |
29SEP04 |
30SEP04 |
| Walks & Landscape |
0.00.1 |
5 |
06OCT04 |
10OCT04 |
| Drainage |
0.01 |
1 |
28SEP04 |
29SEP04 |
| Gutters & Downspouts |
0.01.0 |
1 |
28SEP04 |
28SEP04 |
| Storm Drains |
0.01.1 |
1 |
29SEP04 |
29SEP04 |
| Wiring |
0.02 |
1 |
14SEP04 |
05OCT04 |
| Initial Wiring |
0.02.0 |
2 |
14SEP04 |
15SEP04 |
| Kitchen Fixtures |
0.02.1 |
1 |
03OCT04 |
03OCT04 |
| Finish Electrical |
0.02.2 |
1 |
04OCT04 |
04OCT04 |
| Finish Carpentry |
0.02.3 |
3 |
03OCT04 |
05OCT04 |
| Plumbing |
0.03 |
1 |
10SEP04 |
04OCT04 |
| Rough Plumbing |
0.03.0 |
3 |
11SEP04 |
13SEP04 |
| Basement Plumbing |
0.03.1 |
1 |
10SEP04 |
10SEP04 |
| Finish Plumbing |
0.03.2 |
2 |
03OCT04 |
04OCT04 |
| Foundation |
0.04 |
1 |
04SEP04 |
15SEP04 |
| Excavate & Footers |
0.04.0 |
4 |
04SEP04 |
07SEP04 |
| Pour Foundation |
0.04.1 |
2 |
08SEP04 |
09SEP04 |
| Pour Basement |
0.04.2 |
2 |
14SEP04 |
15SEP04 |
| Roofing |
0.05 |
1 |
10SEP04 |
27SEP04 |
| Finish Roof |
0.05.0 |
2 |
26SEP04 |
27SEP04 |
| Frame & Roof |
0.05.1 |
4 |
10SEP04 |
13SEP04 |
| Flooring |
0.06 |
1 |
30SEP04 |
12OCT04 |
| Varnish Floor |
0.06.0 |
2 |
11OCT04 |
12OCT04 |
| Finish Flooring |
0.06.1 |
3 |
30SEP04 |
02OCT04 |
| Heat & Ventilation |
0.07 |
4 |
16SEP04 |
19SEP04 |
| Plaster |
0.08 |
10 |
20SEP04 |
29SEP04 |
| Brickwork |
0.09 |
6 |
20SEP04 |
25SEP04 |
| Paint |
0.10 |
3 |
06OCT04 |
08OCT04 |
|
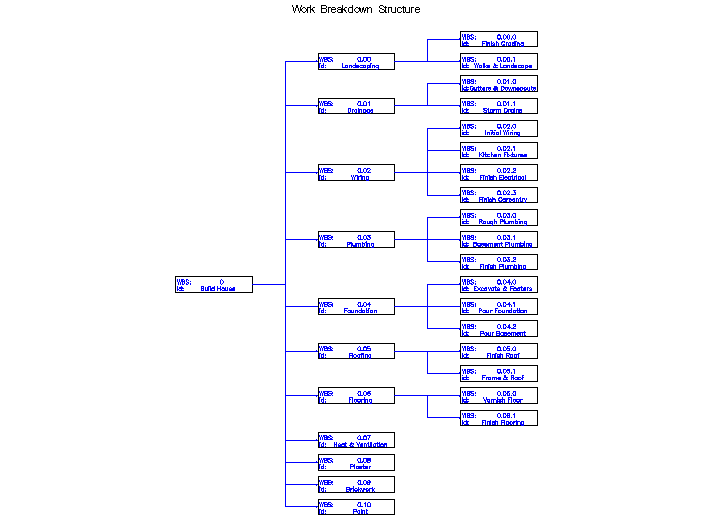
The Work Breakdown Structure for the project is given in Figure 9.2.2; this
chart was created using the %EVG_WBS_CHART macro.
    %evg_wbs_chart(
     structure=gbsched,
     activity=activity,
     project=project,
     id=wbs_code id,
     rotate=N,
     rotatetext=N,
     defid=N
    );
Output 9.2.2: %EVG_WBS_CHART: Work Breakdown Structure
Figure 9.2.3 lists the budgeted costs for each task.
Output 9.2.3: Budgeted Cost Rates GBASE
| Build House |
0 |
0 |
0 |
| Landscaping |
0 |
0 |
0 |
| Drainage |
0 |
0 |
0 |
| Wiring |
0 |
0 |
0 |
| Plumbing |
0 |
0 |
0 |
| Foundation |
0 |
0 |
0 |
| Roofing |
0 |
0 |
0 |
| Flooring |
0 |
0 |
0 |
| Heat & Ventilation |
325 |
50 |
40 |
| Plaster |
14500 |
1,2,3,4 |
20 |
| Brickwork |
9500 |
1,2,3 |
45 |
| Paint |
3250 |
50 |
30 |
| Finish Grading |
425 |
25 |
25 |
| Walks & Landscape |
2475 |
25 |
25 |
| Gutters & Downspouts |
1200 |
50 |
15 |
| Storm Drains |
150 |
25 |
15 |
| Initial Wiring |
575 |
25 |
45 |
| Kitchen Fixtures |
375 |
25 |
25 |
| Finish Electrical |
550 |
25 |
50 |
| Finish Carpentry |
1450 |
25 |
20 |
| Rough Plumbing |
1025 |
25 |
30 |
| Basement Plumbing |
1000 |
25 |
50 |
| Finish Plumbing |
350 |
25 |
20 |
| Excavate & Footers |
5250 |
50 |
20 |
| Pour Foundation |
1500 |
25 |
15 |
| Pour Basement |
950 |
50 |
20 |
| Finish Roof |
725 |
50 |
40 |
| Frame & Roof |
9500 |
25 |
35 |
| Varnish Floor |
750 |
25 |
15 |
| Finish Flooring |
425 |
50 |
25 |
|
Note that the "Storm Drains" task, in the sixteenth observation,
costs one quarter (25%) of
$150 upon initiation and continues at a rate of $15/day. When complete,
the balance (75%) of the $150 is charged.
Weighted milestones are
specified for the "Plaster" activity, given in Observation 10.
At the start, one tenth
 of $14,500, or $1,450, is incurred.
The rate is $20/day. When the task is
one third complete, another fifth
of $14,500, or $1,450, is incurred.
The rate is $20/day. When the task is
one third complete, another fifth  of $14,500, or $2,900, is incurred. At completion, the cost is two fifths
 of $14,500, or $5,800.
The %EVA_PLANNED_VALUE macro is next invoked to compute the periodic planned value.
    %eva_planned_value(
        plansched=gbsched,
        activity=activity,
        start=start,
        finish=finish,
        budgetcost=gbase,
        rate=rate,
        cost=cost,
        spct=spct,
        taskpv=bout,
        pv=gbcost
    );
The periodic planned value data set is shown in Figure 9.2.4.
Output 9.2.4: %EVA_PLANNED_VALUE: Periodic Data Set
| 04SEP04 |
2645.00 |
| 05SEP04 |
20.00 |
| 06SEP04 |
20.00 |
| 07SEP04 |
2645.00 |
| 08SEP04 |
390.00 |
| 09SEP04 |
1140.00 |
| 10SEP04 |
3460.00 |
| 11SEP04 |
321.25 |
| 12SEP04 |
65.00 |
| 13SEP04 |
7958.75 |
| 14SEP04 |
683.75 |
| 15SEP04 |
971.25 |
| 16SEP04 |
202.50 |
| 17SEP04 |
40.00 |
| 18SEP04 |
40.00 |
| 19SEP04 |
202.50 |
| 20SEP04 |
3098.33 |
| 21SEP04 |
65.00 |
| 22SEP04 |
3231.67 |
| 23SEP04 |
2965.00 |
| 24SEP04 |
65.00 |
| 25SEP04 |
4815.00 |
| 26SEP04 |
4772.50 |
| 27SEP04 |
422.50 |
| 28SEP04 |
1235.00 |
| 29SEP04 |
6116.25 |
| 30SEP04 |
581.25 |
| 01OCT04 |
25.00 |
| 02OCT04 |
237.50 |
| 03OCT04 |
890.00 |
| 04OCT04 |
902.50 |
| 05OCT04 |
1107.50 |
| 06OCT04 |
2298.75 |
| 07OCT04 |
55.00 |
| 08OCT04 |
1680.00 |
| 09OCT04 |
25.00 |
| 10OCT04 |
1881.25 |
| 11OCT04 |
202.50 |
| 12OCT04 |
577.50 |
|
Notice that the TASKPV= parameter has been used to ultimately pass the planned
activity duration and costs to %EVA_EARNED_VALUE. Assume that the schedule has been
updated to reflect actual start and
finish times, as of the status date September 15, 2004. The updated schedule is
shown in Figure 9.2.5.
Output 9.2.5: Updated Schedule GASCHED
| Build House |
0 |
1 |
04SEP04 |
17OCT04 |
| Landscaping |
0.00 |
1 |
04OCT04 |
15OCT04 |
| Drainage |
0.01 |
1 |
03OCT04 |
04OCT04 |
| Wiring |
0.02 |
1 |
19SEP04 |
10OCT04 |
| Plumbing |
0.03 |
1 |
15SEP04 |
09OCT04 |
| Foundation |
0.04 |
1 |
04SEP04 |
20SEP04 |
| Roofing |
0.05 |
1 |
15SEP04 |
02OCT04 |
| Flooring |
0.06 |
1 |
05OCT04 |
17OCT04 |
| Heat & Ventilation |
0.07 |
4 |
21SEP04 |
24SEP04 |
| Plaster |
0.08 |
10 |
25SEP04 |
04OCT04 |
| Brickwork |
0.09 |
6 |
25SEP04 |
30SEP04 |
| Paint |
0.10 |
3 |
11OCT04 |
13OCT04 |
| Finish Grading |
0.00.0 |
2 |
04OCT04 |
05OCT04 |
| Walks & Landscape |
0.00.1 |
5 |
11OCT04 |
15OCT04 |
| Gutters & Downspouts |
0.01.0 |
1 |
03OCT04 |
03OCT04 |
| Storm Drains |
0.01.1 |
1 |
04OCT04 |
04OCT04 |
| Initial Wiring |
0.02.0 |
2 |
19SEP04 |
20SEP04 |
| Kitchen Fixtures |
0.02.1 |
1 |
08OCT04 |
08OCT04 |
| Finish Electrical |
0.02.2 |
1 |
09OCT04 |
09OCT04 |
| Finish Carpentry |
0.02.3 |
3 |
08OCT04 |
10OCT04 |
| Rough Plumbing |
0.03.0 |
3 |
16SEP04 |
18SEP04 |
| Basement Plumbing |
0.03.1 |
1 |
15SEP04 |
15SEP04 |
| Finish Plumbing |
0.03.2 |
2 |
08OCT04 |
09OCT04 |
| Excavate & Footers |
0.04.0 |
4 |
04SEP04 |
11SEP04 |
| Pour Foundation |
0.04.1 |
2 |
12SEP04 |
14SEP04 |
| Pour Basement |
0.04.2 |
2 |
19SEP04 |
20SEP04 |
| Finish Roof |
0.05.0 |
2 |
01OCT04 |
02OCT04 |
| Frame & Roof |
0.05.1 |
4 |
15SEP04 |
18SEP04 |
| Varnish Floor |
0.06.0 |
2 |
16OCT04 |
17OCT04 |
| Finish Flooring |
0.06.1 |
3 |
05OCT04 |
07OCT04 |
|
The updated cost rates are given in Figure 9.2.6.
Output 9.2.6: Updated Cost Rates GACT
| Build House |
0 |
0 |
0 |
| Landscaping |
0 |
0 |
0 |
| Drainage |
0 |
0 |
0 |
| Wiring |
0 |
0 |
0 |
| Plumbing |
0 |
0 |
0 |
| Foundation |
0 |
0 |
0 |
| Roofing |
0 |
0 |
0 |
| Flooring |
0 |
0 |
0 |
| Heat & Ventilation |
40 |
325 |
50 |
| Plaster |
20 |
14500 |
1,2,3,4 |
| Brickwork |
45 |
9500 |
1,2,3 |
| Paint |
30 |
3250 |
50 |
| Finish Grading |
25 |
425 |
25 |
| Walks & Landscape |
25 |
2475 |
25 |
| Gutters & Downspouts |
15 |
1200 |
50 |
| Storm Drains |
15 |
150 |
25 |
| Initial Wiring |
45 |
575 |
25 |
| Kitchen Fixtures |
25 |
375 |
25 |
| Finish Electrical |
50 |
550 |
25 |
| Finish Carpentry |
20 |
1450 |
25 |
| Rough Plumbing |
30 |
1025 |
25 |
| Basement Plumbing |
50 |
1000 |
25 |
| Finish Plumbing |
20 |
350 |
25 |
| Excavate & Footers |
30 |
6350 |
50 |
| Pour Foundation |
30 |
2700 |
25 |
| Pour Basement |
20 |
950 |
50 |
| Finish Roof |
40 |
725 |
50 |
| Frame & Roof |
35 |
9500 |
25 |
| Varnish Floor |
15 |
750 |
25 |
| Finish Flooring |
25 |
425 |
50 |
|
The %EVA_EARNED_VALUE macro can then be called as follows:
    %eva_earned_value(
        revisesched=gasched,
        activity=activity,
        start=start,
        finish=finish,
        actualcost=gact,
        rate=rate,
        cost=cost,
        spct=spct,
        taskpv=bout,
        ev=gacost
    );
The periodic earned value data set
that is generated by %EVA_EARNED_VALUE is shown in Figure 9.2.7.
Output 9.2.7: %EVA_EARNED_VALUE: Periodic Data Set
| 04SEP04 |
2635.00 |
3205.00 |
| 05SEP04 |
10.00 |
30.00 |
| 06SEP04 |
10.00 |
30.00 |
| 07SEP04 |
10.00 |
30.00 |
| 08SEP04 |
10.00 |
30.00 |
| 09SEP04 |
10.00 |
30.00 |
| 10SEP04 |
10.00 |
30.00 |
| 11SEP04 |
2635.00 |
3205.00 |
| 12SEP04 |
385.00 |
705.00 |
| 13SEP04 |
10.00 |
30.00 |
| 14SEP04 |
1135.00 |
2055.00 |
| 15SEP04 |
3460.00 |
3460.00 |
| 16SEP04 |
321.25 |
321.25 |
| 17SEP04 |
65.00 |
65.00 |
| 18SEP04 |
7958.75 |
7958.75 |
| 19SEP04 |
683.75 |
683.75 |
| 20SEP04 |
971.25 |
971.25 |
| 21SEP04 |
202.50 |
202.50 |
| 22SEP04 |
40.00 |
40.00 |
| 23SEP04 |
40.00 |
40.00 |
| 24SEP04 |
202.50 |
202.50 |
| 25SEP04 |
3098.33 |
3098.33 |
| 26SEP04 |
65.00 |
65.00 |
| 27SEP04 |
3231.67 |
3231.67 |
| 28SEP04 |
2965.00 |
2965.00 |
| 29SEP04 |
65.00 |
65.00 |
| 30SEP04 |
4815.00 |
4815.00 |
| 01OCT04 |
4772.50 |
4772.50 |
| 02OCT04 |
422.50 |
422.50 |
| 03OCT04 |
1235.00 |
1235.00 |
| 04OCT04 |
6116.25 |
6116.25 |
| 05OCT04 |
581.25 |
581.25 |
| 06OCT04 |
25.00 |
25.00 |
| 07OCT04 |
237.50 |
237.50 |
| 08OCT04 |
890.00 |
890.00 |
| 09OCT04 |
902.50 |
902.50 |
| 10OCT04 |
1107.50 |
1107.50 |
| 11OCT04 |
2298.75 |
2298.75 |
| 12OCT04 |
55.00 |
55.00 |
| 13OCT04 |
1680.00 |
1680.00 |
| 14OCT04 |
25.00 |
25.00 |
| 15OCT04 |
1881.25 |
1881.25 |
| 16OCT04 |
202.50 |
202.50 |
| 17OCT04 |
577.50 |
577.50 |
|
The BUDGETCOST= parameter has been employed to capture the planned duration
and costs for each activity. Next, the %EVA_METRICS macro is used to
produce statistics for the entire project. For illustrative purposes,
a range of times from the start of the project to the revised
projected end date is used. Typically, only actual status dates
would be used; in this case, perhaps September 4, 2004 and September
15, 2004. Unless otherwise noted, the latter is the assumption for
the remainder of the macros in this example.
    %eva_metrics(
        pv=gbcost,
        ev=gacost,
        timenow='04SEP04'd '15SEP04'd '01OCT04'd '17OCT04'd
    );
The output listing is given in Figure 9.2.8.
Output 9.2.8: %EVA_METRICS: Summary Statistics
| 4.54 |
17.78 |
68.59 |
100.00 |
| 2645.00 |
20320.00 |
48197.50 |
58055.00 |
| 2635.00 |
10320.00 |
39817.50 |
58055.00 |
| 3205.00 |
12840.00 |
42337.50 |
60575.00 |
| -570.00 |
-2520.00 |
-2520.00 |
-2520.00 |
| -21.63 |
-24.42 |
-6.33 |
-4.34 |
| -10.00 |
-10000.00 |
-8380.00 |
0.00 |
| -0.38 |
-49.21 |
-17.39 |
0.00 |
| 0.82 |
0.80 |
0.94 |
0.96 |
| 1.00 |
0.51 |
0.83 |
1.00 |
| 58055.00 |
58055.00 |
58055.00 |
58055.00 |
| 60575.00 |
60575.00 |
60575.00 |
60575.00 |
| 58625.00 |
60575.00 |
60575.00 |
60575.00 |
| 70613.39 |
72231.22 |
61729.23 |
60575.00 |
| 70869.21 |
129780.85 |
65810.42 |
60575.00 |
| 67408.39 |
59391.22 |
19391.73 |
0.00 |
| -12558.39 |
-14176.22 |
-3674.23 |
-2520.00 |
| -21.63 |
-24.42 |
-6.33 |
-4.34 |
| 1.01 |
1.06 |
1.16 |
0.00 |
| 0.82 |
0.80 |
0.94 |
0.94 |
|
Observe that the Estimate To Complete (ETC) and Schedule
Performance Index (SPI) converge to 0 and 1, respectively, over time.
Also, the Actual Cost (AC) agrees with the various Estimates
At Completion (EAC's) at the projected completion date.
Next, the %EVA_TASK_METRICS macro is used to show an activity-level view of the progress of the project.
    %eva_task_metrics(
        activity=id,
        plansched=gbsched,
        revisesched=gasched,
        start=start,
        finish=finish,
        budgetcost=gbase,
        actualcost=gact,
        cost=cost,
        spct=spct,
        rate=rate,
        timenow='15SEP04'd,
        aggregate=Y
    );
The AGGREGATE= parameter is specified in order to roll up the values
with respect to the project hierarchy. The output from this macro is shown in
Figure 9.2.9.
Output 9.2.9: %EVA_TASK_METRICS: Metrics by Activity
| Build House |
0 |
20320.00 |
10320.00 |
12840.00 |
-2520.00 |
-24.42 |
-10000.00 |
-49.21 |
0.80 |
0.51 |
| Landscaping |
0.00 |
0.00 |
0.00 |
0.00 |
0.00 |
0.00 |
0.00 |
0.00 |
. |
. |
| Drainage |
0.01 |
0.00 |
0.00 |
0.00 |
0.00 |
0.00 |
0.00 |
0.00 |
. |
. |
| Wiring |
0.02 |
665.00 |
0.00 |
0.00 |
0.00 |
0.00 |
-665.00 |
-100.00 |
. |
0.00 |
| Plumbing |
0.03 |
2165.00 |
1050.00 |
1050.00 |
0.00 |
0.00 |
-1115.00 |
-51.50 |
1.00 |
0.48 |
| Foundation |
0.04 |
7850.00 |
6860.00 |
9380.00 |
-2520.00 |
-36.73 |
-990.00 |
-12.61 |
0.73 |
0.87 |
| Roofing |
0.05 |
9640.00 |
2410.00 |
2410.00 |
0.00 |
0.00 |
-7230.00 |
-75.00 |
1.00 |
0.25 |
| Flooring |
0.06 |
0.00 |
0.00 |
0.00 |
0.00 |
0.00 |
0.00 |
0.00 |
. |
. |
| Heat & Ventilation |
0.07 |
0.00 |
0.00 |
0.00 |
0.00 |
0.00 |
0.00 |
0.00 |
. |
. |
| Plaster |
0.08 |
0.00 |
0.00 |
0.00 |
0.00 |
0.00 |
0.00 |
0.00 |
. |
. |
| Brickwork |
0.09 |
0.00 |
0.00 |
0.00 |
0.00 |
0.00 |
0.00 |
0.00 |
. |
. |
| Paint |
0.10 |
0.00 |
0.00 |
0.00 |
0.00 |
0.00 |
0.00 |
0.00 |
. |
. |
| Finish Grading |
0.00.0 |
0.00 |
0.00 |
0.00 |
0.00 |
0.00 |
0.00 |
0.00 |
. |
. |
| Walks & Landscape |
0.00.1 |
0.00 |
0.00 |
0.00 |
0.00 |
0.00 |
0.00 |
0.00 |
. |
. |
| Gutters & Downspouts |
0.01.0 |
0.00 |
0.00 |
0.00 |
0.00 |
0.00 |
0.00 |
0.00 |
. |
. |
| Storm Drains |
0.01.1 |
0.00 |
0.00 |
0.00 |
0.00 |
0.00 |
0.00 |
0.00 |
. |
. |
| Initial Wiring |
0.02.0 |
665.00 |
0.00 |
0.00 |
0.00 |
0.00 |
-665.00 |
-100.00 |
. |
0.00 |
| Kitchen Fixtures |
0.02.1 |
0.00 |
0.00 |
0.00 |
0.00 |
0.00 |
0.00 |
0.00 |
. |
. |
| Finish Electrical |
0.02.2 |
0.00 |
0.00 |
0.00 |
0.00 |
0.00 |
0.00 |
0.00 |
. |
. |
| Finish Carpentry |
0.02.3 |
0.00 |
0.00 |
0.00 |
0.00 |
0.00 |
0.00 |
0.00 |
. |
. |
| Rough Plumbing |
0.03.0 |
1115.00 |
0.00 |
0.00 |
0.00 |
0.00 |
-1115.00 |
-100.00 |
. |
0.00 |
| Basement Plumbing |
0.03.1 |
1050.00 |
1050.00 |
1050.00 |
0.00 |
0.00 |
0.00 |
0.00 |
1.00 |
1.00 |
| Finish Plumbing |
0.03.2 |
0.00 |
0.00 |
0.00 |
0.00 |
0.00 |
0.00 |
0.00 |
. |
. |
| Excavate & Footers |
0.04.0 |
5330.00 |
5330.00 |
6590.00 |
-1260.00 |
-23.64 |
0.00 |
0.00 |
0.81 |
1.00 |
| Pour Foundation |
0.04.1 |
1530.00 |
1530.00 |
2790.00 |
-1260.00 |
-82.35 |
0.00 |
0.00 |
0.55 |
1.00 |
| Pour Basement |
0.04.2 |
990.00 |
0.00 |
0.00 |
0.00 |
0.00 |
-990.00 |
-100.00 |
. |
0.00 |
| Finish Roof |
0.05.0 |
0.00 |
0.00 |
0.00 |
0.00 |
0.00 |
0.00 |
0.00 |
. |
. |
| Frame & Roof |
0.05.1 |
9640.00 |
2410.00 |
2410.00 |
0.00 |
0.00 |
-7230.00 |
-75.00 |
1.00 |
0.25 |
| Varnish Floor |
0.06.0 |
0.00 |
0.00 |
0.00 |
0.00 |
0.00 |
0.00 |
0.00 |
. |
. |
| Finish Flooring |
0.06.1 |
0.00 |
0.00 |
0.00 |
0.00 |
0.00 |
0.00 |
0.00 |
. |
. |
|
Output 9.2.10: %EVA_TASK_METRICS: Metrics by Activity (Continued)
| Build House |
0 |
20320.00 |
10320.00 |
12840.00 |
-2520.00 |
-24.42 |
-10000.00 |
-49.21 |
0.80 |
0.51 |
| Landscaping |
0.00 |
0.00 |
0.00 |
0.00 |
0.00 |
0.00 |
0.00 |
0.00 |
. |
. |
| Drainage |
0.01 |
0.00 |
0.00 |
0.00 |
0.00 |
0.00 |
0.00 |
0.00 |
. |
. |
| Wiring |
0.02 |
665.00 |
0.00 |
0.00 |
0.00 |
0.00 |
-665.00 |
-100.00 |
. |
0.00 |
| Plumbing |
0.03 |
2165.00 |
1050.00 |
1050.00 |
0.00 |
0.00 |
-1115.00 |
-51.50 |
1.00 |
0.48 |
| Foundation |
0.04 |
7850.00 |
6860.00 |
9380.00 |
-2520.00 |
-36.73 |
-990.00 |
-12.61 |
0.73 |
0.87 |
| Roofing |
0.05 |
9640.00 |
2410.00 |
2410.00 |
0.00 |
0.00 |
-7230.00 |
-75.00 |
1.00 |
0.25 |
| Flooring |
0.06 |
0.00 |
0.00 |
0.00 |
0.00 |
0.00 |
0.00 |
0.00 |
. |
. |
| Heat & Ventilation |
0.07 |
0.00 |
0.00 |
0.00 |
0.00 |
0.00 |
0.00 |
0.00 |
. |
. |
| Plaster |
0.08 |
0.00 |
0.00 |
0.00 |
0.00 |
0.00 |
0.00 |
0.00 |
. |
. |
| Brickwork |
0.09 |
0.00 |
0.00 |
0.00 |
0.00 |
0.00 |
0.00 |
0.00 |
. |
. |
| Paint |
0.10 |
0.00 |
0.00 |
0.00 |
0.00 |
0.00 |
0.00 |
0.00 |
. |
. |
| Finish Grading |
0.00.0 |
0.00 |
0.00 |
0.00 |
0.00 |
0.00 |
0.00 |
0.00 |
. |
. |
| Walks & Landscape |
0.00.1 |
0.00 |
0.00 |
0.00 |
0.00 |
0.00 |
0.00 |
0.00 |
. |
. |
| Gutters & Downspouts |
0.01.0 |
0.00 |
0.00 |
0.00 |
0.00 |
0.00 |
0.00 |
0.00 |
. |
. |
| Storm Drains |
0.01.1 |
0.00 |
0.00 |
0.00 |
0.00 |
0.00 |
0.00 |
0.00 |
. |
. |
| Initial Wiring |
0.02.0 |
665.00 |
0.00 |
0.00 |
0.00 |
0.00 |
-665.00 |
-100.00 |
. |
0.00 |
| Kitchen Fixtures |
0.02.1 |
0.00 |
0.00 |
0.00 |
0.00 |
0.00 |
0.00 |
0.00 |
. |
. |
| Finish Electrical |
0.02.2 |
0.00 |
0.00 |
0.00 |
0.00 |
0.00 |
0.00 |
0.00 |
. |
. |
| Finish Carpentry |
0.02.3 |
0.00 |
0.00 |
0.00 |
0.00 |
0.00 |
0.00 |
0.00 |
. |
. |
| Rough Plumbing |
0.03.0 |
1115.00 |
0.00 |
0.00 |
0.00 |
0.00 |
-1115.00 |
-100.00 |
. |
0.00 |
| Basement Plumbing |
0.03.1 |
1050.00 |
1050.00 |
1050.00 |
0.00 |
0.00 |
0.00 |
0.00 |
1.00 |
1.00 |
| Finish Plumbing |
0.03.2 |
0.00 |
0.00 |
0.00 |
0.00 |
0.00 |
0.00 |
0.00 |
. |
. |
| Excavate & Footers |
0.04.0 |
5330.00 |
5330.00 |
6590.00 |
-1260.00 |
-23.64 |
0.00 |
0.00 |
0.81 |
1.00 |
| Pour Foundation |
0.04.1 |
1530.00 |
1530.00 |
2790.00 |
-1260.00 |
-82.35 |
0.00 |
0.00 |
0.55 |
1.00 |
| Pour Basement |
0.04.2 |
990.00 |
0.00 |
0.00 |
0.00 |
0.00 |
-990.00 |
-100.00 |
. |
0.00 |
| Finish Roof |
0.05.0 |
0.00 |
0.00 |
0.00 |
0.00 |
0.00 |
0.00 |
0.00 |
. |
. |
| Frame & Roof |
0.05.1 |
9640.00 |
2410.00 |
2410.00 |
0.00 |
0.00 |
-7230.00 |
-75.00 |
1.00 |
0.25 |
| Varnish Floor |
0.06.0 |
0.00 |
0.00 |
0.00 |
0.00 |
0.00 |
0.00 |
0.00 |
. |
. |
| Finish Flooring |
0.06.1 |
0.00 |
0.00 |
0.00 |
0.00 |
0.00 |
0.00 |
0.00 |
. |
. |
|
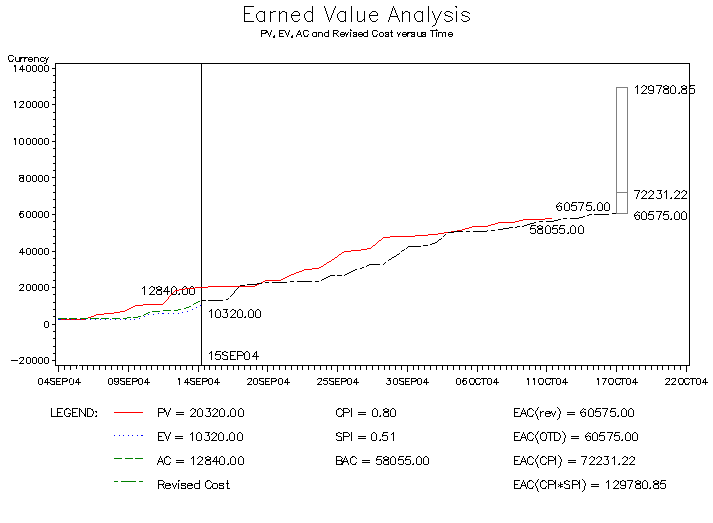
Next, the %EVG_COST_PLOT macro is called to show the
Planned Value (PV), Earned Value (EV), Actual Cost (AC), and revised
cost plots.
%evg_cost_plot;
The plot is shown in Figure 9.2.11.
Output 9.2.11: %EVG_COST_PLOT,PV,EV,AC and Revised Cost
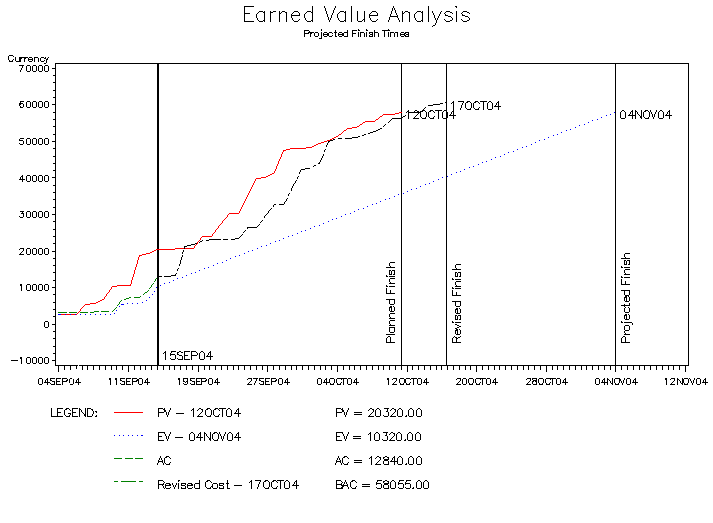
The %EVG_SCHEDULE_PLOT macro is used to show different estimates of the project completion date.
%evg_schedule_plot;
The plot is shown in Figure 9.2.12.
Output 9.2.12: %EVG_SCHEDULE_PLOT: Estimated Completion Dates
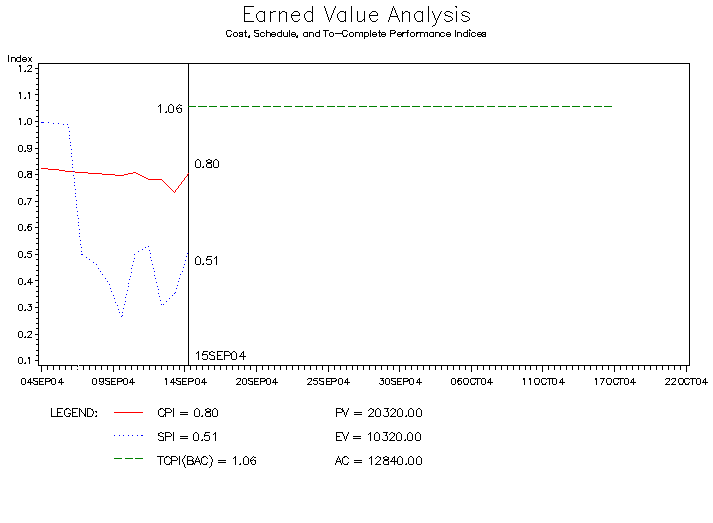
The %EVG_INDEX_PLOT macro is used to graphically display the performance indices for the project.
%evg_index_plot;
The plot is shown in Figure 9.2.13. As in the previous
example, the cost performance needs to increase from 0.8 to
1.06 in order to stay within the budget.
Output 9.2.13: %EVG_INDEX_PLOT: CPI,SPI,and TCPI
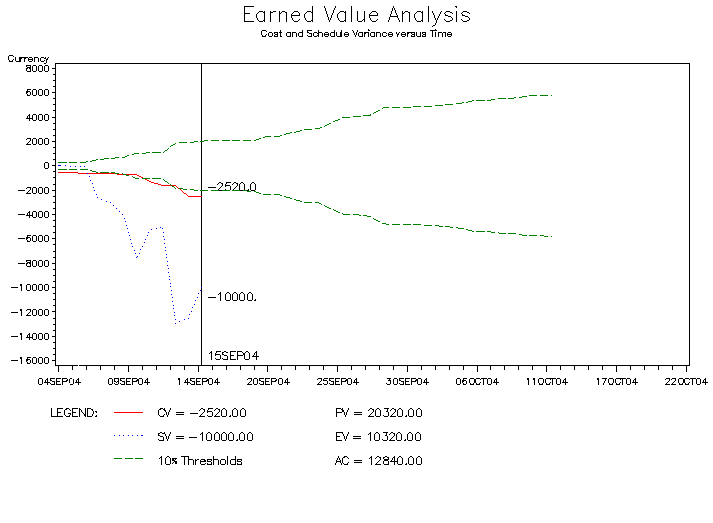
The Cost and Schedule Variance for the project is shown in Figure 9.2.14
using the following call to the %EVG_VARIANCE_PLOT macro:
%evg_variance_plot;
Output 9.2.14: %EVG_VARIANCE_PLOT: Cost and Schedule Variance
While the Cost Variance is just outside the 10% threshold, the
Schedule Variance is significantly outside and should be a warning
signal that the project is slipping significantly. The plan
called for $20,320 of work to be completed, but only $10,320
has been accomplished so far (roughly 50% of the goal).
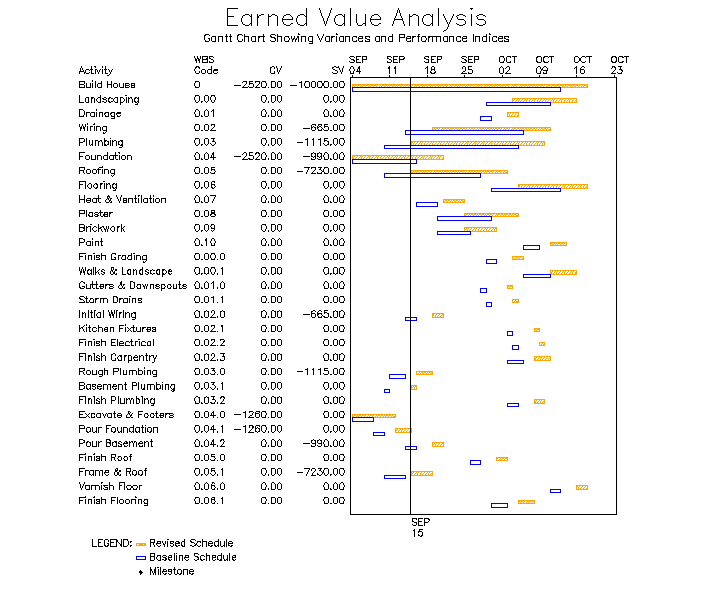
Finally, the %EVG_GANTT_CHART macro is used to show a Gantt view of the
project along with some metrics by task. In this case, only
the Work Breakdown Structure code and Cost Variance (CV) and
Schedule Variance (SV) are selected.
    %evg_gantt_chart(
        activity=id,
        plansched=gbsched,
        revisesched=gasched,
        start=start,
        finish=finish,
        timenow='15SEP04'd,
        id=wbs cv sv,
        height=3,
        scale=20
    );
The resulting Gantt chart is shown in Figure 9.2.15.
Output 9.2.15: %EVG_GANTT_CHART: Cost and Schedule Variance by Task