Examples: INTPOINT Procedure
- 5.1 Production, Inventory, Distribution Problem
- 5.2 Altering Arc Data
- 5.3 Adding Side Constraints
- 5.4 Using Constraints and More Alteration to Arc Data
- 5.5 Nonarc Variables in the Side Constraints
- 5.6 Solving an LP Problem with Data in MPS Format
- 5.7 Converting to an MPS-Format SAS Data Set
- 5.8 Migration to OPTMODEL: Production, Inventory, Distribution
The following examples illustrate some of the capabilities of PROC INTPOINT. These examples, together with the other SAS/OR examples, can be found in the SAS sample library.
In order to illustrate variations in the use of the INTPOINT procedure, Example 5.1 through Example 5.5 use data from a company that produces two sizes of televisions. The company makes televisions with a diagonal screen measurement of either 19 inches or 25 inches. These televisions are made between March and May at both of the company’s two factories. Each factory has a limit on the total number of televisions of each screen dimension that can be made during those months.
The televisions are distributed to one of two shops, stored at the factory where they were made, and sold later or shipped to the other factory. Some sets can be used to fill backorders from the previous months. Each shop demands a number of each type of TV for the months of March through May. The following network in Figure 5.12 illustrates the model. Arc costs can be interpreted as production costs, storage costs, backorder penalty costs, inter-factory transportation costs, and sales profits. The arcs can have capacities and lower flow bounds.
Figure 5.12: TV Problem
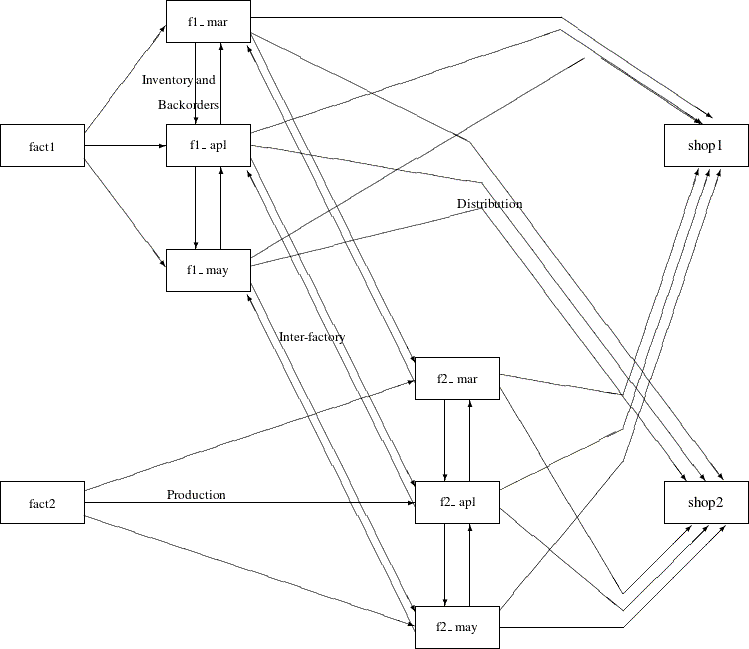
There are two similarly structured networks, one for the 19-inch televisions and the other for the 25-inch screen TVs. The minimum cost production, inventory, and distribution plan for both TV types can be determined in the same run of PROC INTPOINT. To ensure that node names are unambiguous, the names of nodes in the 19-inch network have suffix _1, and the node names in the 25-inch network have suffix _2.