Create Model Comparison and Summary Reports

In this exercise, you create several model comparison reports that are used in the selection and approval of a champion model. The Model Profile report can be created for any type of model. The Interval Target Variable report can be created only for a prediction model. After you create the reports, you view them in the Reports folder. The reports enable you to evaluate candidate models in a version or across versions by assessing the structure, performance, and resilience of your models.

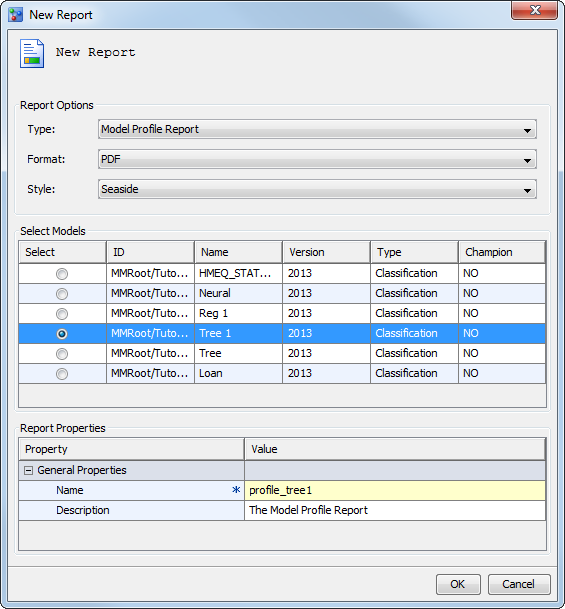
Create a Model Profile Report

The Model Profile report creates three tables to display the profile data that is associated with the model input variables, output variables, and target variables. To create this report:
  1. Expand the 2013 version in the Loan project and right-click the Reports folder. Then select Reportsthen selectNew Report. The New Report window appears.
  2. In the New Report window, use the specified values for these fields and click OK:
    Type
    select Model Profile Report.
    Format
    select PDF. PDF is the default value, and it might already be the value for Format.
    Style
    select Seaside. SAS default is the default style for the selected SAS format.
    Select Models
    select the radio button for Tree 1.
    Report Properties
    replace the default report name with the report name profile_tree1 in the Name field.
    Here is the New Report window at this point in the process. Click OK when you are finished.
    New Report wizard to create model profile report
  3. When the information dialog box confirms that the report was created successfully, click Close.

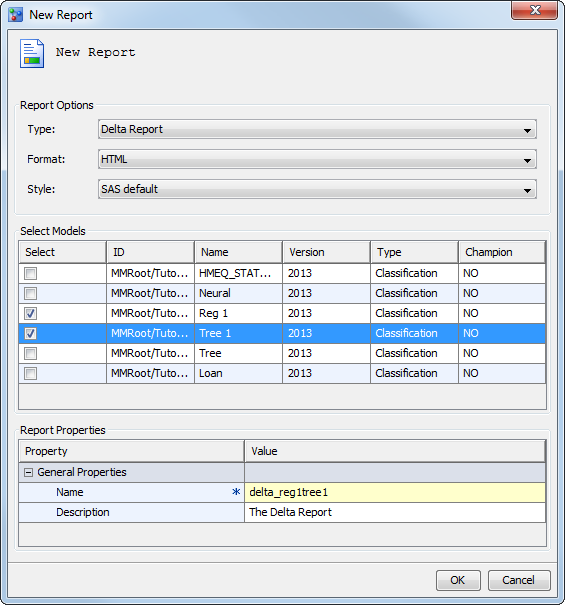
Create a Delta Report

The Delta report compares the profile data for two models and notes the differences. To create this report:
  1. Expand the 2013 version in the Loan project and right-click the Reports folder. Then select Reportsthen selectNew Report. The New Report window appears.
  2. In the New Report window, use the specified values for these fields and click OK:
    Type
    select Delta Report.
    Format
    select HTML.
    Style
    select SAS default. SAS default is the default style for the selected SAS format. For example, the default SAS style for the HTML format is HTMLBLUE.
    Select Models
    select the boxes for Reg 1 and Tree 1.
    Report Properties
    replace the default report name with the report name delta_reg1tree1 in the Name field.
    Here is the New Report window at this point in the process. Click OK when you are finished.
    New Report wizard to create delta report
  3. When the information dialog box confirms that the report was created successfully, click Close.

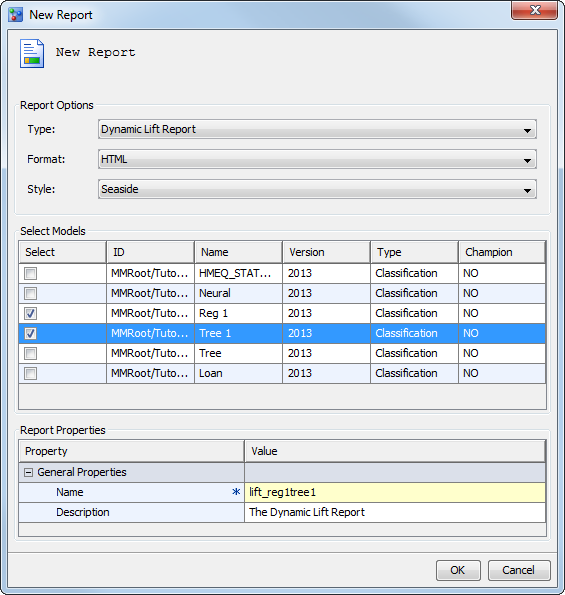
Create a Dynamic Lift Report

The Dynamic Lift report provides visual summaries of the performance of one or more models for predicting a binary outcome variable performance. To create this report:
  1. Expand the 2013 version in the Loan project and right-click the Reports folder. Then select Reportsthen selectNew Report. The New Report window appears.
  2. In the New Report window, specify the following options and click OK:
    Type
    select Dynamic Lift Report.
    Format
    select HTML.
    Style
    select Seaside. SAS default is the default style for the selected SAS format.
    Select Models
    select the boxes for Reg 1 and Tree 1.
    Report Properties
    replace the default report name with the report name lift_reg1tree1 in the Name field.
    Here is the New Report Wizard at this point in the process. Click OK when you are finished.
    New Report wizard to create dynamic lift report
  3. When the information dialog box confirms that the report was created successfully, click Close.

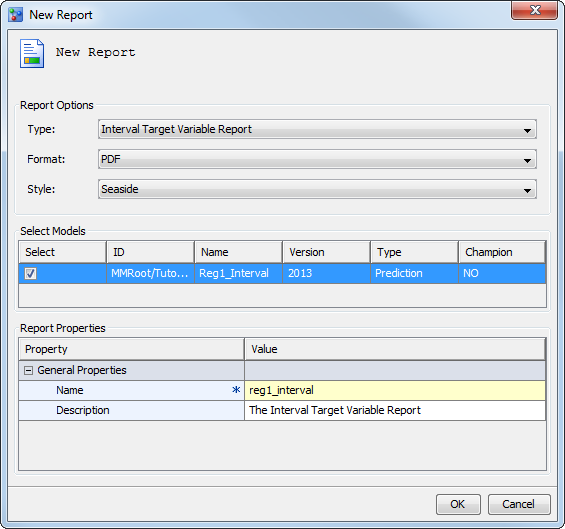
Create an Interval Target Variable Report

The Interval Target Variable report creates two plots for you to view the actual versus predicted values for a model and the actual versus residual values for a model. This report can be created only for prediction models.
Note: This report is created based on the sample data of the default test table. By default, the sample size is 1000 and the sample seed is 12345. When the sample size is less than or equal to 5000, the chart that is created in the report is a scatter plot. When the sample size is greater than 5000, the chart that is created in the report is a heat map. If you are using your own data sets and want to create an Interval Target Variable Report that contains a heat map, contact your SAS Administrator. Request that the Sample size for models with an interval target configuration setting be changed to greater than 5000.
To create this report:
  1. Expand the 2013 version in the HMEQ-Interval project and right-click the Reports folder. Then select Reportsthen selectNew Report. The New Report window appears.
  2. In the New Report window, specify the following options and click OK:
    Type
    select Interval Target Variable Report.
    Format
    select PDF.
    Style
    select Seaside. SAS default is the default style for the selected SAS format.
    Select Models
    select the box for Reg1_Interval.
    Report Properties
    replace the default report name with the report name reg1_interval in the Name field.
    Here is the New Report Wizard at this point in the process. Click OK when you are finished.
    New Report wizard to create interval target variable report
  3. When the information dialog box confirms that the report was created successfully, click Close.

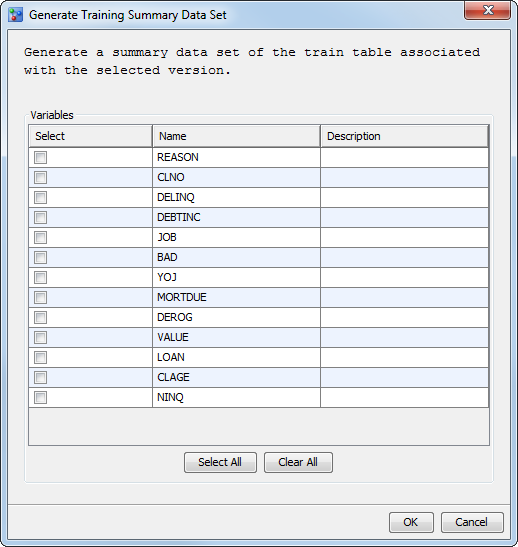
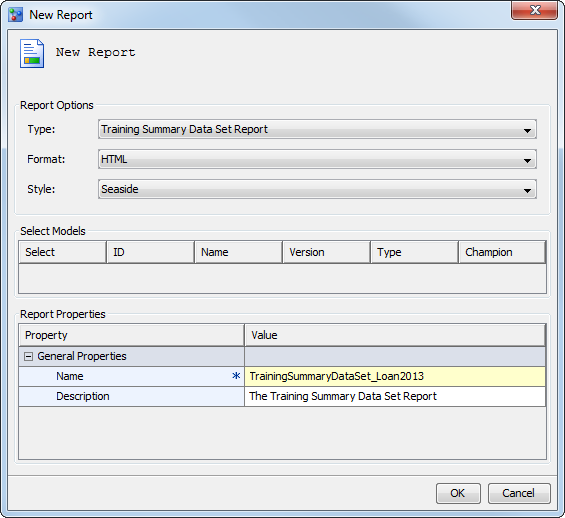
Training Summary Data Set Report (Optional)

About

A Training Summary Data Set report creates frequency and distribution charts that summarize the train table variables. Using the default train table, SAS Model Manager generates data sets in the Resources folder that contain numeric and character variable summaries, and variable distributions. These data sets are used to create the summary report. Before you can create the report, you must generate the training summary data sets.
In this exercise, you generate the training summary data sets and create a Training Summary Data Set report.

Generate Training Summary Data Sets

To generate the training summary data sets:
  1. Select the 2013 version in the Loan project and verify that the Default Train Table property contains the train table for the report.
  2. Right-click the 2013 version and select Generate Training Summary Data Set. The Generate Training Summary Data Set window appears.
    Generate Training Data Set
  3. Click Select All to select all variables. To select only a few variables for the report, select the box that is next to each variable in the Select column.
  4. Click OK. SAS Model Manager creates data sets in the Resources folder.

Create a Training Summary Data Set Report

To generate a Training Summary Data Set report for a version:
  1. Expand the 2013 version in the Loan project and right-click the Reports folder. Then select Reportsthen selectNew Report. The New Report window appears.
  2. In the New Report window, specify the following options and click OK:
    Type
    select Training Summary Data Set Report.
    Format
    select HTML.
    Style
    select Seaside. SAS default is the default style for the SAS format that is selected.
    Select Models
    Not applicable.
    Report Properties
    replace the default report name with the report name TrainingSummaryDataSet_Loan2013 in the Name field.
    Here is the New Report Wizard at this point in the process.
    New Report wizard to create Training Summary Data Set report
  3. When the information dialog box confirms that the report was created successfully, click Close.

View a Model Comparison and Summary Reports

To view a model comparison report:
  1. Expand the version folder 2013 and the Reports folder.
  2. Right-click the report name and select View Report.
    Note: If user credentials are required, then specify a user ID and password that have permission to access the SAS Content Server.
  3. Use the PDF or HTML viewer to distribute or print a copy of the report.
  4. Close the PDF or HTML viewer.
For a detailed description of the model comparison reports, see the SAS Model Manager: User's Guide.

Update the Life Cycle (Optional)

To update the Development milestone:
  1. In the Loan project, expand 2013then selectLife Cyclethen selectDevelopment.
  2. Select the Create comparison reports task. Select the Status box and select Completed.
  3. Select Create comparison reports. The Completed Date and Completed By fields have been updated with today's date and your user ID.
  4. Click the Life Cycle node to examine its properties. The value for Date Modified is today's date. The Development property displays a bar chart that shows the percentage of completed tasks for this milestone.
    The life cycle status of the Development milestone.
  5. (Optional) Repeat steps 1 through 4 for the HMEQ-Interval project.

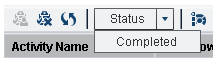
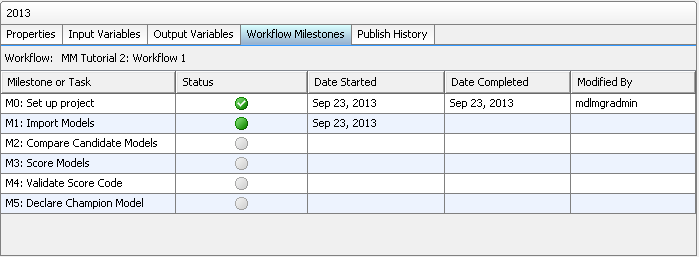
Update the Workflow Process (Optional)

To complete the activities in the associated workflow:
  1. Select Toolsthen selectMy Workflow Inbox or click My Workflow Inbox from the SAS Model Manager main window to view the workflow activities in your workflow inbox. Workflow Console is launched in a web browser, and displays the Activities category view.
    Note: The list displays only the activities for which you are the actual owner or are assigned as a potential owner, and that have the state of Started.
  2. From the Activities category view, select an activity name, and click Claim the activity.
    Note: You can select an activity name and click Release the activity to release an activity that you had previously claimed.
  3. (Optional) Enter a property value or change an existing property value in the Properties pane.
  4. (Optional) Double-click an activity to view the activity details. From the activity details view, you can modify activity properties or perform the model management tasks that are associated with the activity.
    Note: If you did not claim the activity from the Activities category view, you can select the Claim check box in the activity status bar.
  5. (Optional) Add a comment to the activity using the Comments pane.
  6. Select a status value to complete the activity. The workflow continues to the next activity.
    Activity Status Menu
  7. Repeat steps 2 through 6 for the activities that you completed during this tutorial.
    Note: A workflow can be configured to display the activities that are associated with a milestone or task on the Workflow Milestones tab and in the Workflow Milestones report for a version in the SAS Model Manager client application. From the Workflow Milestones tab, you can view the status of milestones or tasks that are associated with activities in the workflow.
    Workflow Milestones tab
Note: For more information, see Tutorial 11: Using Workflow Console.