Using Dashboard Reports
Overview
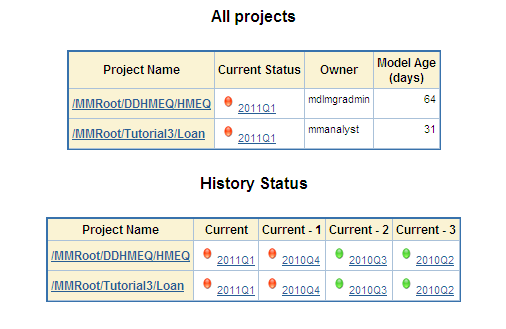
The SAS Model Manager
Dashboard can provide reports that show the overall state of all projects
that are being monitored. The dashboard reports are produced from
existing performance monitoring reports. For each project, a user
can define dashboard report indicators that are then used to create
the dashboard reports. The dashboard reports are not displayed through
the SAS Model Manager user interface. Instead, use a browser window
to view the dashboard reports that are located on the SAS Workspace
Server. These reports are generated in HTML by SAS Model Manager.
Prerequisites
Models Used in Tutorial 3
The exercises in this
tutorial depend on some of the properties of the specific models that
were added in Tutorial 3. Use the projects, versions, or models that
are specified here. This tutorial is designed to follow Tutorial 3: Importing and Exporting Models.
The Required Tutorial Files
The exercises in this
tutorial depend on the performance task data sets that were created
using the tutorial files in Create the Champion Model Performance Data Sets.
Prepare to Use Dashboard Reports
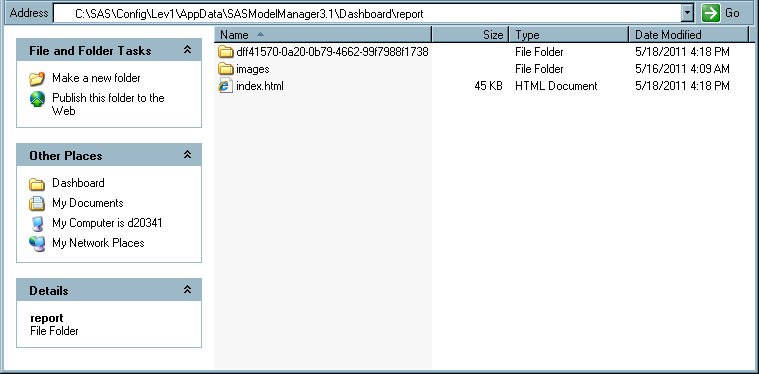
The dashboard report
directory is configured during the installation of SAS Model Manager.
The default directory is
\SASConfigDir\Lev#\AppData\SASModelManager3.1\Dashboard.
To configure a different
directory to store the SAS Model Manager dashboard reports, follow
these steps:
-
Note: In a UNIX environment all SAS Model Manager users must be part of a group that has the appropriate group permissions. For more information, see Creating Operating System Accounts in UNIX Environments in SAS Model Manager: Administrator's Guide and Configuring Users, Groups, and Roles in SAS Model Manager: Administrator's Guide.
-
(optional) Click the Settings tab and then select Model Manager Dashboard Options. This setting enables you to modify formats, styles, and the indicator override. The indicator override configuration enables indicators that have conditions to be available when you add dashboard report indicators using the SAS Model Manager 3.1 Client.
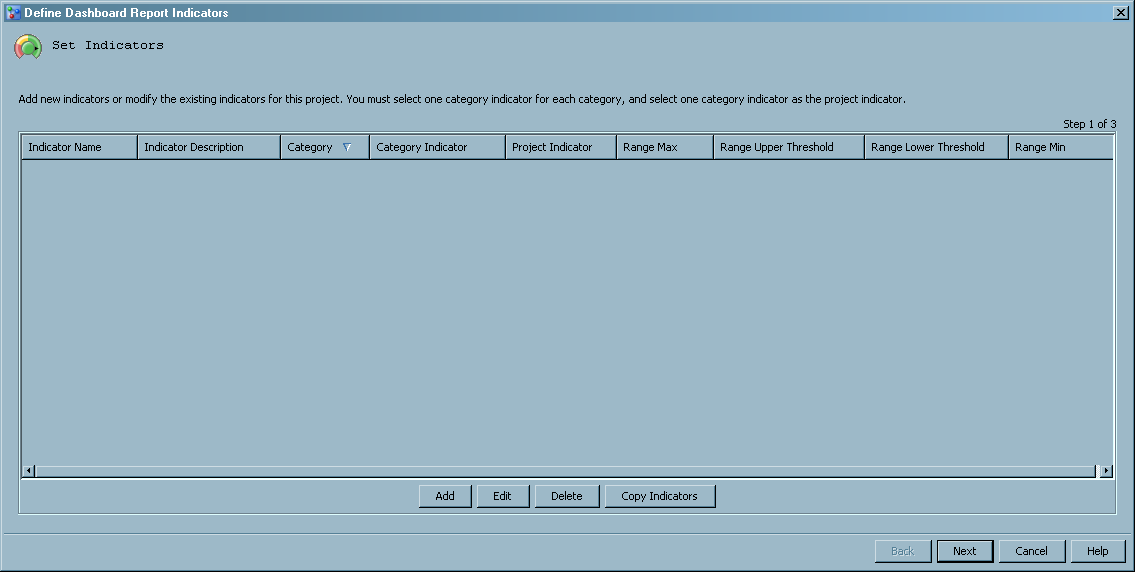
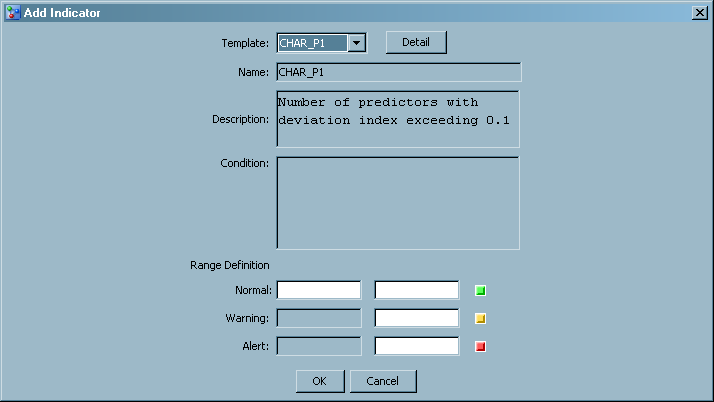
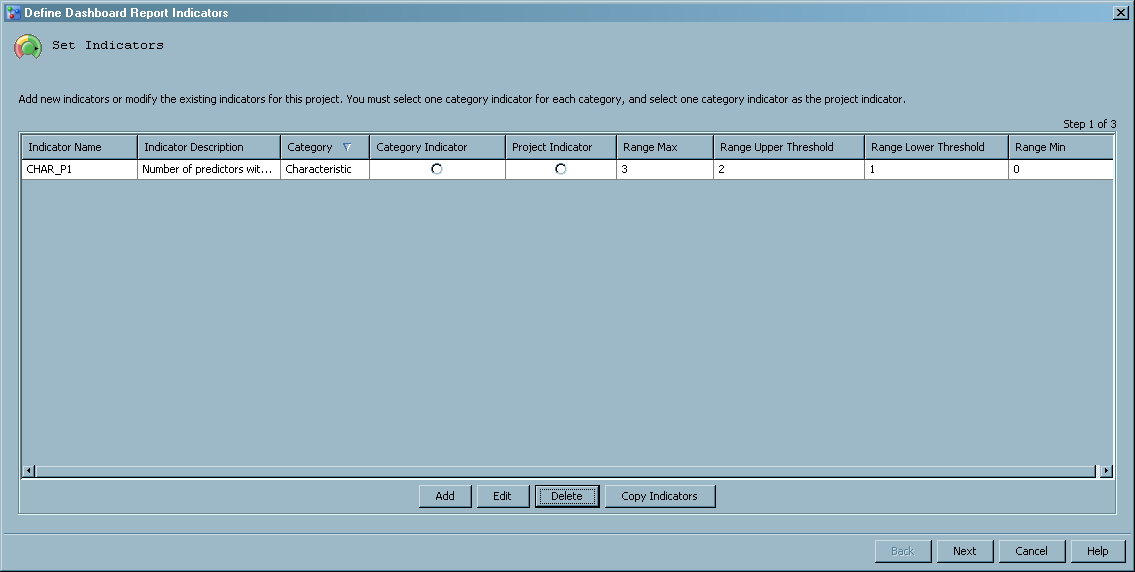
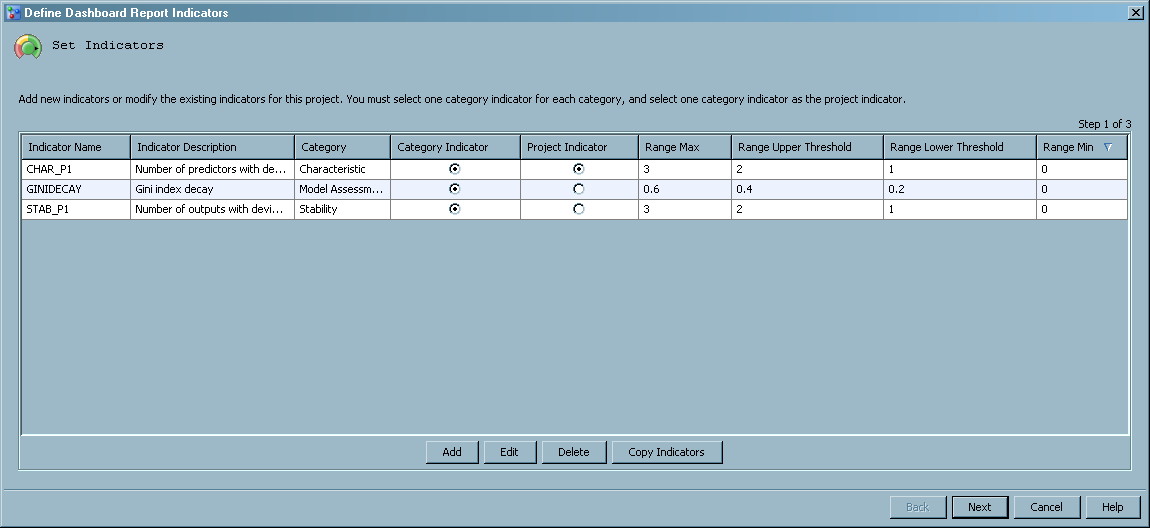
Define Dashboard Report Indicators
-
You must have at least one project that contains performance data before you continue to the next step. For more information, see Create the Champion Model Performance Data Sets.
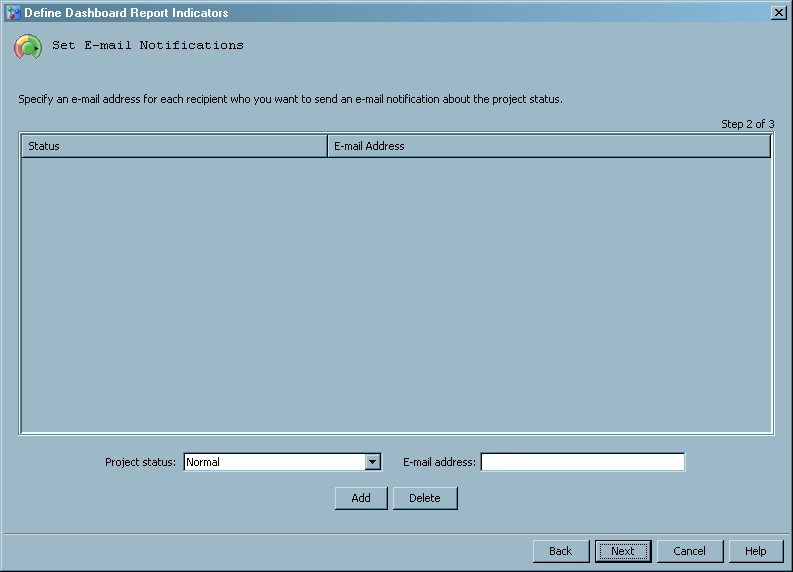
-
Select a value from the Project status drop-down list, enter a value for E-mail address, and click Add. Repeat this step for each recipient who you want to send an e-mail notification to about a status. If you want an individual recipient to receive an e-mail notification for each status, you must repeat this step for each status. To delete an e-mail notification, select a project status, and click Delete.
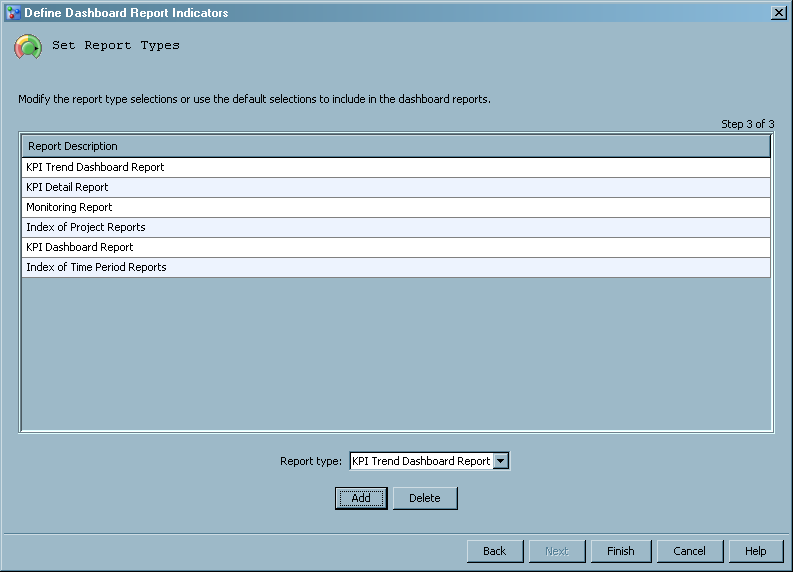
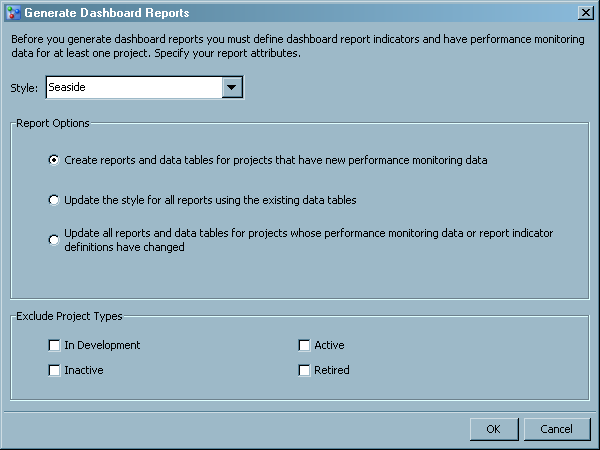
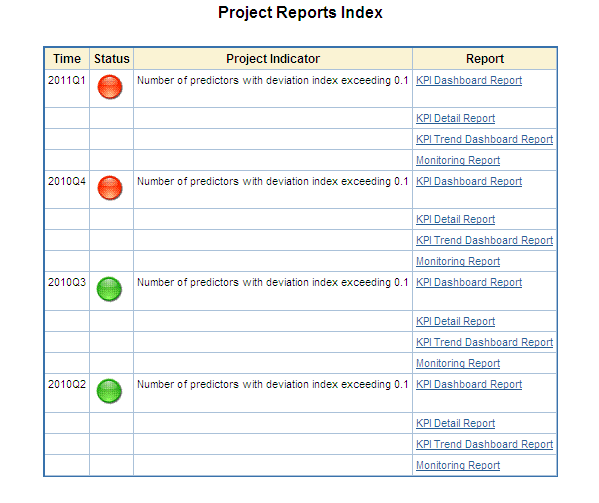
Generate Dashboard Reports
Note: Before you generate dashboard
reports, you must have at least one project that contains performance
data. That project must have at least one dashboard report indicator
that has been defined.
-
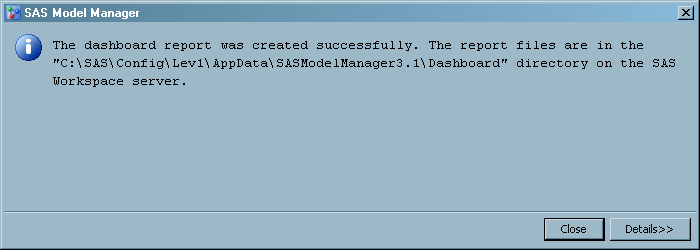
Click OK. You can view the progress of the dashboard reports in the status bar. A message appears that indicates whether the report was created successfully. The message also displays the location of the dashboard reports on the SAS Workspace Server. Here is an example:
C:\SAS\Config\Lev1\AppData\SASModelManager3.1\Dashboard.