Creating Bar and Pie Charts Using SAS Enterprise Guide
This section discusses the means by which bar and
pie charts were created with SAS IT Resource Management 2.7 and the
recommended means by which they are created using SAS IT Resource
Management 3.2.
About Bar and Pie Charts
The following
table shows the eight chart types that are available in SAS IT Resource
Management 2.7 and the corresponding SAS Enterprise Guide task that
is available to generate those chart types in SAS IT Resource Management
3.2.
In SAS Enterprise Guide,
the bar orientations (vertical and horizontal) are task subtype options
that are available in the Bar Chart task. The bar dimensions (two-dimensional
and three-dimensional) are appearance options in the Bar Chart and
Pie Chart tasks.
This section provides
more details about the SAS IT Resource Management 2.7 macros that
create various types of bar and pie charts and the equivalent SAS
Enterprise Guide steps that are required to re-create these types
of reports.
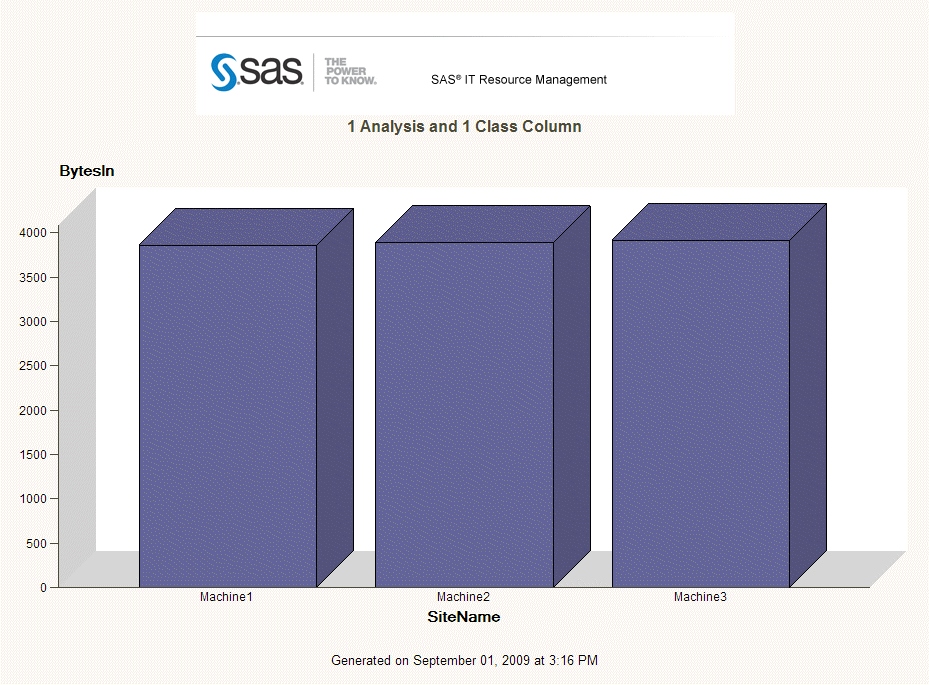
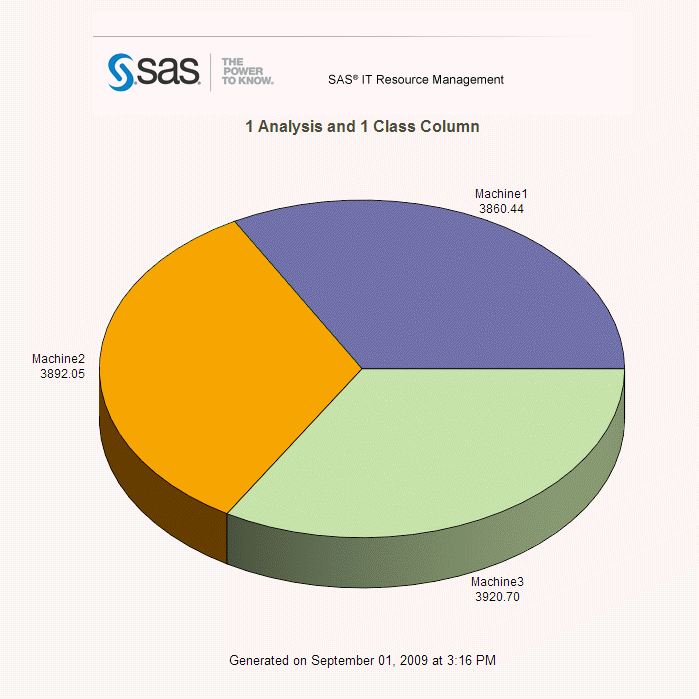
The %CPCHART macro creates a
pie chart of one analysis column and one class column (Example 8).
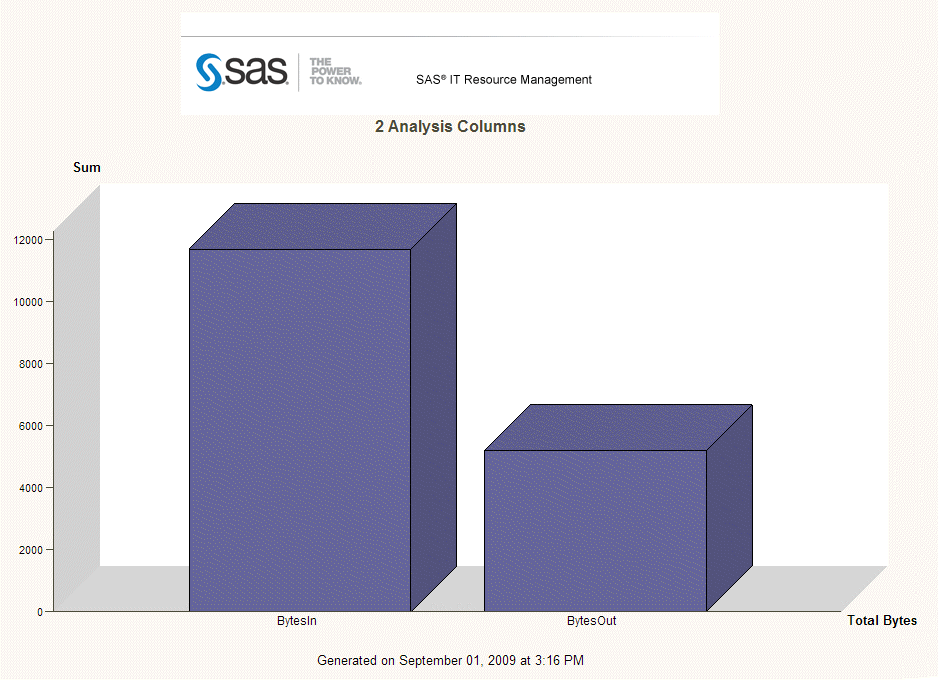
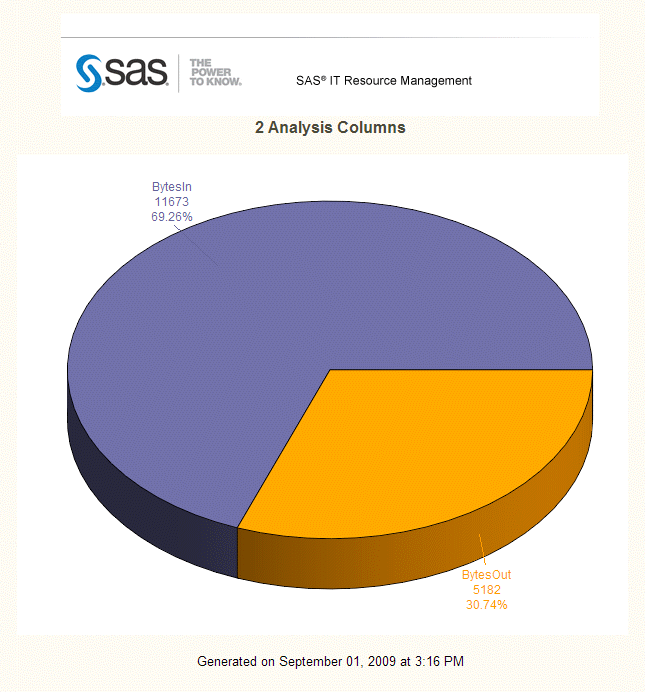
The %CPCCHRT macro creates a
pie chart type of multiple analysis columns (Example 9).
Bar Chart and Pie Chart Notes
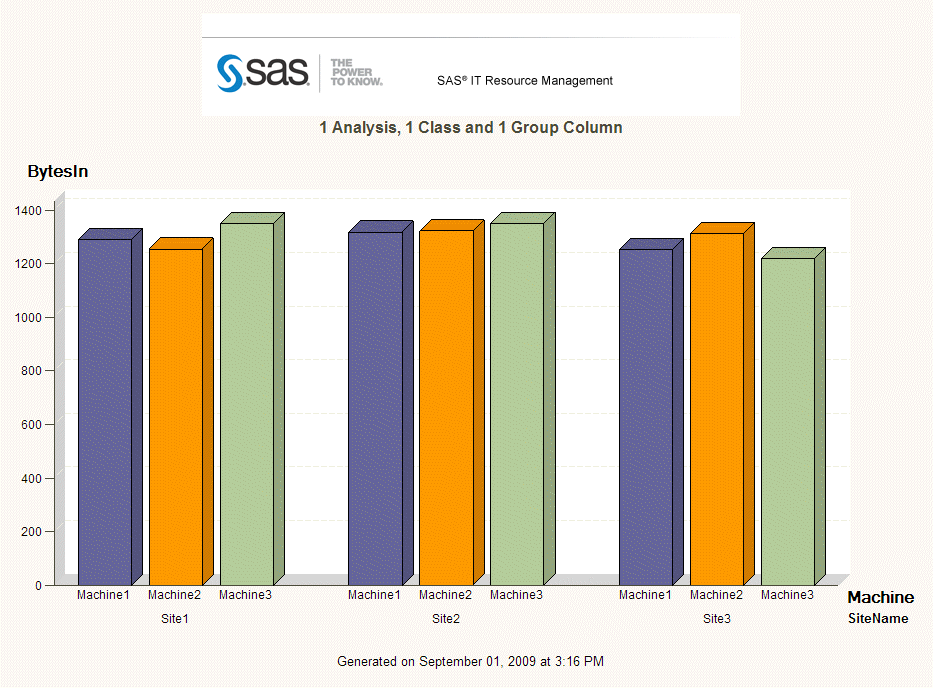
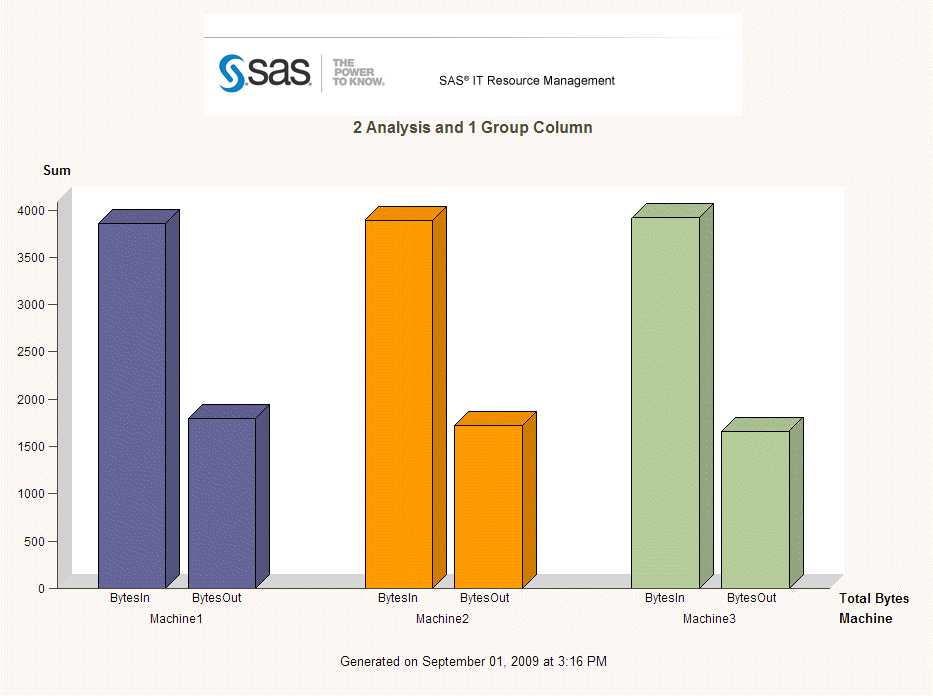
Example 6
Bar Chart with Two Analysis Columns, One Group Column, and One Subgroup Column
-
Rename your new column labels (see Stack Columns Task (Reference 1)).
Note: The difference between this bar chart example and Example 7 is in the column
role assignments.
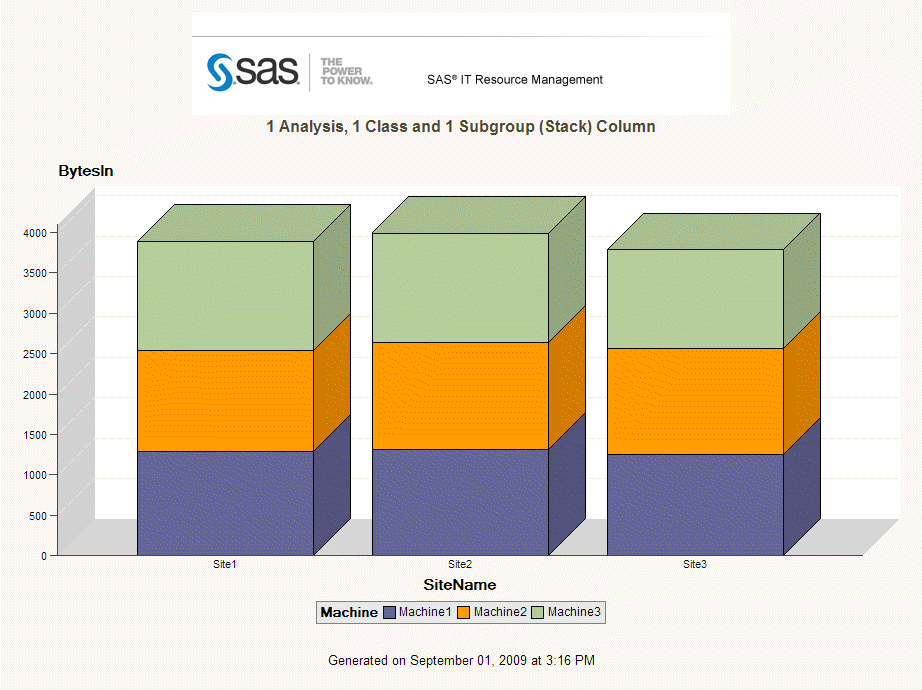
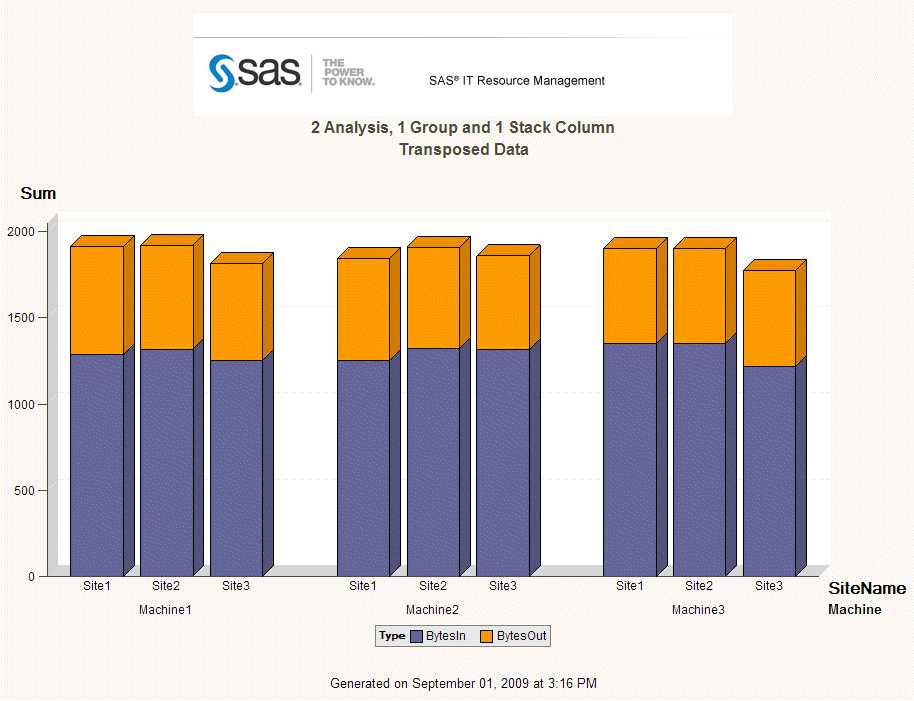
Example 7
Bar Chart with Two Analysis Columns, One Group Column, and One Stack Column
-
Rename your new column labels (see Stack Columns Task (Reference 1)).
Note: The difference between this bar chart example and Example 6 is in the column
role assignments.
Example 9
Pie Chart with Two Analysis Columns
-
Rename your new column labels (see Stack Columns Task (Reference 1)).