Working with Galleries and Albums in the Gallery Workspace
The following topics describe how to view, filter,
and sort reports in the Gallery workspace.
To work with the reports that are created by IT Resource Management,
they must first be organized into a gallery or album. To open a gallery
or album in the Gallery workspace, select
that item from those that are available in
My Galleries
               and Albums
or Shared Galleries and
Albums.
View Reports
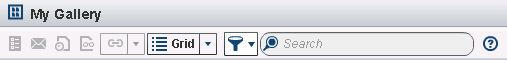
The following display
shows the workspace bar that is available when you are working in
the Gallery workspace.
The Gallery workspace
provides four gallery views that enable you to view and sort the reports
in different ways. Click the Grid button
in the workspace bar to display the types of views that are available.
Here is the list of views:  . The four types of gallery views are displayed in
the following list:
. The four types of gallery views are displayed in
the following list:
. The four types of gallery views are displayed in
the following list:
-
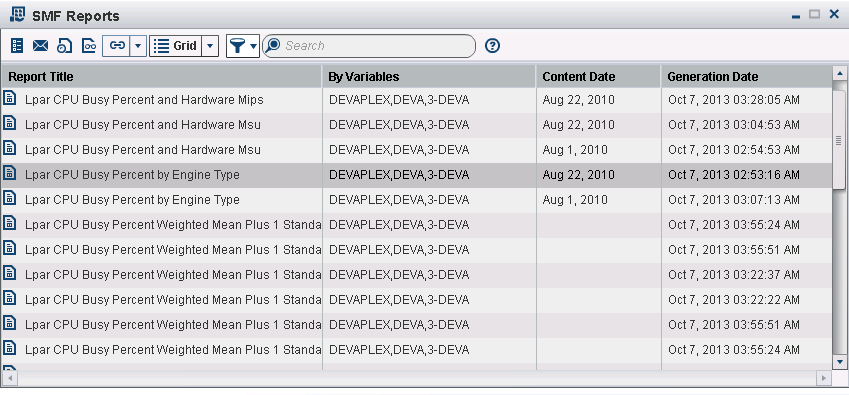
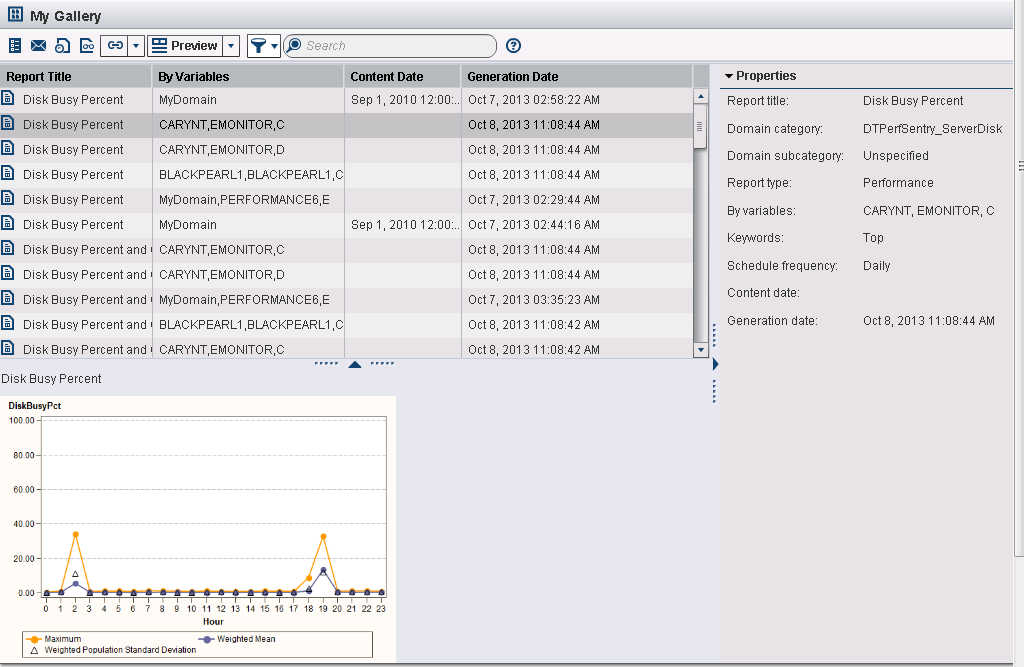
The grid view displays the reports and their associated metadata in a tabular format. The columns in the table include additional information about the reports, such as the title, BY variables, and creation date.You can select a column to sort reports based on that column or to adjust the width of the column in the table. You can quickly scan these report titles for similarities and double-click an individual report to view a large image of it in a separate browser window. This view is the default view.
-
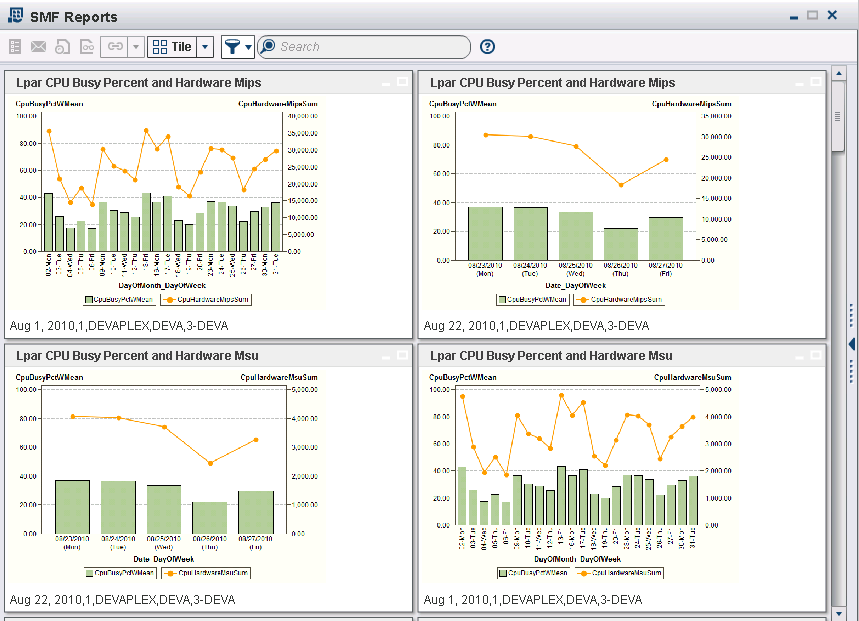
The tile view displays images. This view displays up to four thumbnails of reports at one time. Each tile includes the report title, the BY variables, and a small image of the report. You can double-click an individual report to view a large image of it in a separate browser window.
-
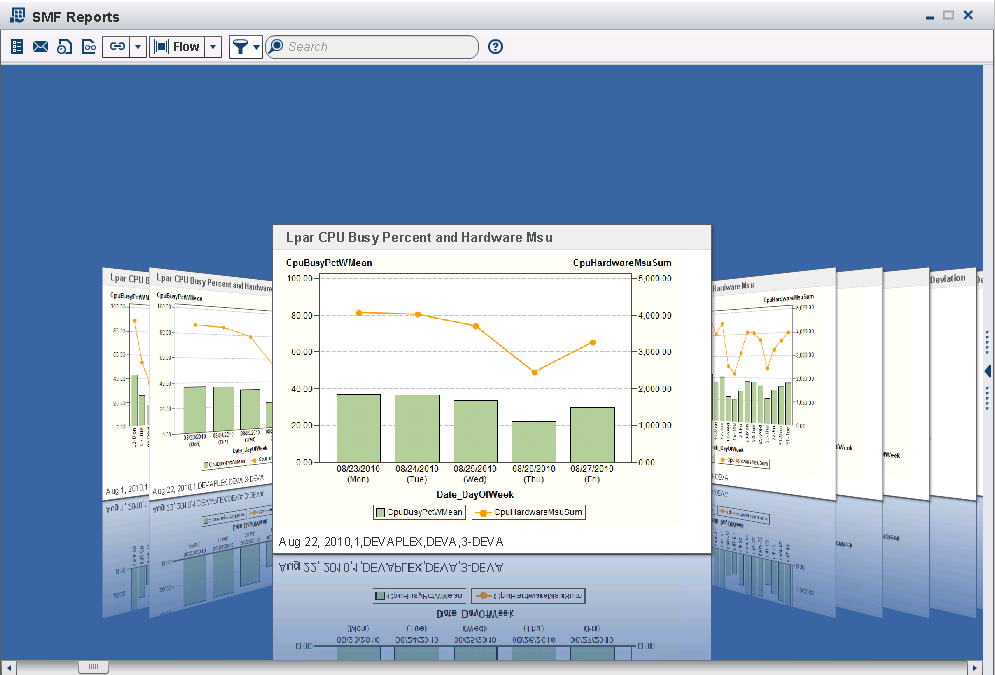
The flow view displays a horizontal stack of reports at one time. Each report image includes the report title, the BY variables, and a small image of the report.This view displays the reports as moveable pages so that you can navigate through a sequence of reports that are stacked together. You can double-click an individual report to view a large image of it in a separate browser window.
-
The Preview option displays a shortened list of the reports that are shown in the grid view and a Preview pane below. Click a report in the grid area to see a thumbnail image in the preview area. Double-click a report in the grid area or the preview area to see a larger view of the report in a separate browser window.
Filter Reports
You can use filters
to subset the view of reports in a gallery by one or more criteria.
This process reduces the number of reports that are shown in the gallery
so that you can limit the display to those specific reports that meet
your filter criteria.
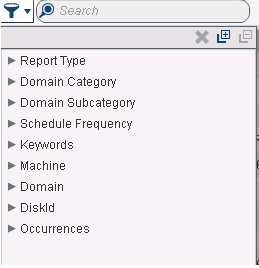
The filter variables
in the Filters pane are criteria that restrict the gallery reports
that are displayed when viewing a gallery in the Gallery workspace.
When you select a filter variable within a group, you see only the
reports that include the variable that you selected. However, if you
do not select a variable within a given filter group, then the displayed
reports can include any of the variables that are related to the filter
group.
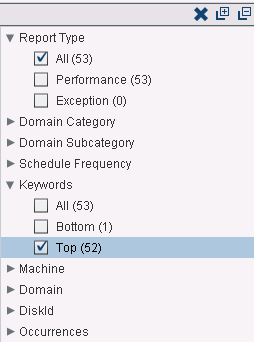
For example, a filter
group named Machine might
include four variables that correspond to four machines in your organization:
DEVA, GOLDFINGER4, P0A2, and PERFORMANCE6. If you select the variable
DEVA, then only the gallery reports for the DEVA machine appear.
If you select multiple
filter variables in a single filter group, then the Gallery pane displays
only the reports that meet any of those selected criteria. If you
select a filter variable in two different filter groups, then the
Gallery pane displays only the reports that meet both criteria for
the two distinct filter groups.
-
Click the arrow next to the type of filter that you want to specify. The list of available values for a filter varies based on the BY variables that are in the reports in the open gallery. Thus, the filters that are available for selection might change each time a new gallery is selected for filtering.

Note: Applying filters does not
modify the gallery. It only subsets the reports in the gallery for
viewing. Therefore, the applied filters last only for the current
instance of the gallery. The next time you access the gallery, you
will see all of the reports in the gallery and you will be able to
apply another set of filter criteria if necessary.
Sort Reports
The column headings
of the preview and grid views enable you to sort the reports by column.
The default order is alphanumeric ascending order by report title,
BY variables, and report generation date.
When you click a column
heading in the preview and grid views, an up arrow (ascending) or
down arrow (descending) icon appears. These arrows indicate whether
the information in the columns is sorted by ascending or descending
order. For example, when the down arrow ( ) is displayed in the column
heading, then the information in that column is sorted by descending
order. You can click the arrow in a column heading to change the sort
order for that column.
) is displayed in the column
heading, then the information in that column is sorted by descending
order. You can click the arrow in a column heading to change the sort
order for that column.
) is displayed in the column
heading, then the information in that column is sorted by descending
order. You can click the arrow in a column heading to change the sort
order for that column.
Copyright © SAS Institute Inc. All rights reserved.