Architecture and Basic Principles for Data Administrators
The Architecture of SAS IT Resource Management
SAS IT Resource Management
uses data integration and business intelligence components that are
provided by the SAS Intelligence Platform as well as additional software
that was designed specifically for the processing of IT resource data.
At installation time, users can deploy these components across multiple
tiers. Using a multi-tier architecture to separate major software
functions supports flexible processing schemes. The following functions
can be supported on the tiers that SAS IT Resource Management uses:
-
The server tier provides services that access data and perform background processing such as managing the metadata, executing stored processes, and performing resource aggregation calculations. In addition, the server tier provides the metadata for the files and tables that are input to and generated by the SAS IT Resource Management software.
With multi-tier
processing, the tiers can be separated so that the processing can
be done on multiple machines. The SAS IT Resource Management client
must run on Windows. The SAS IT Resource Management middle tier and
server can run in Windows, UNIX, or z/OS
The following diagram
displays the architectural components that constitute the clients,
middle tier, and servers that are used by SAS IT Resource Management.
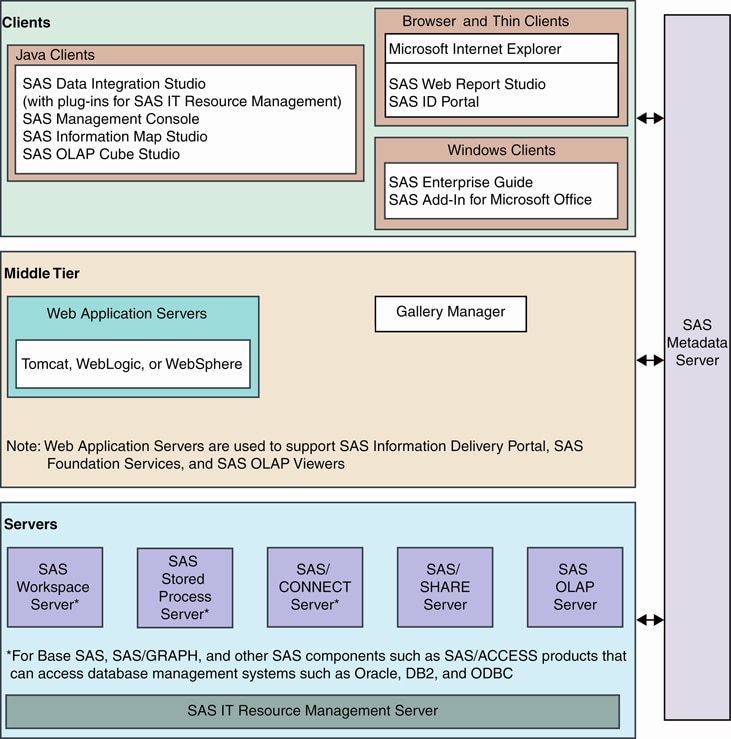
Note: The multiple tiers shown
in this diagram represent categories of software that perform similar
functions. They do not necessarily represent separate machines or
processors. In addition, your site might not need to use all of these
software components. For example, if your site does not use the SAS
Add-In for Microsoft Office, you do not need to install it.
The Basic Principles and Components of SAS IT Resource Management
Preliminary Tasks
SAS IT Resource Management
has the flexibility to support customers whose usage of the product
can range from the basic to the highly complex. Information consumers
can work with specialized tools to access their IT data directly and
generate ad hoc reports. Information consumers can use these reports
to answer specific questions about the health and efficiency of the
enterprise's IT resources. In all cases, the raw data for the resources
that are being evaluated must be staged and aggregated. The resulting
tables are input to the information maps and the reporting processes.
The following information
describes the preliminary tasks that must be performed in order to
use SAS IT Resource Management. After SAS IT Resource Management is
installed and before the staging and aggregating processes can run,
the data administrator uses SAS Management Console to perform the
following setup tasks:
-
Define SAS Content Server mapping for use by SAS IT Resource Management report packages. The SAS Content Server requires an HTTP server in order to be used by SAS Web Report Studio and other SAS Business Intelligence Platform applications. This server must be configured so that its content and its metadata are synchronized and are compatible with the file structure of SAS IT Resource Management.
For more information
about these tasks, see Working with SAS Management Console.
Using SAS IT Resource Management
After the preliminary
tasks and initial setup are complete, you can use SAS IT Resource
Management to process and evaluate IT resource data. SAS IT Resource
Management provides the processes and the supporting technology that
are required to regularly collect, aggregate, analyze, and report
on the IT performance evaluation data that is vital to the health
of an enterprise.
To start SAS IT Resource Management from the Windows Start menu, select Programs SASSAS IT Resource Management.
In general, the processes
that gather and monitor IT performance evaluation data consist of
the following steps.
-
IT performance data is information about IT resources, such as hardware, operating system software, networks, Web servers, databases, and applications. Raw (or unprocessed) data about the usage or performance of these resources is generated by the logging mechanisms that are inherent to IT resources or is created by the Enterprise Systems Management tools that are used to manage the IT infrastructure. The raw data is input to SAS IT Resource Management transformations that are supplied with SAS IT Resource Management software.For information about how to generate and reference the raw data for supported adapters, see the various "Accessing Raw Data" topics in Data Sources Supported by SAS IT Resource Management Adapters.
-
The raw data is processed (or staged) by adapters that are tailored to the data sources that they process. The adapter's staging code performs functions such as normalizing measurement units, generating computed columns from the raw data, and checking for duplicate data. Staging is performed by transformations that are set up in jobs. The job that actually executes the transformation can run interactively but is normally scheduled to run in batch mode, depending on the requirements of your enterprise.A unique staging transformation is supplied for each adapter that is supported by SAS IT Resource Management. It contains the code and can access the associated templates that are needed to process and load the raw data into staged tables. The staged tables can then be used as input to an Aggregation transformation or other SAS Data Integration Studio and SAS IT Resource Management transformations.Information about these staging components is available in the following topics.
-
For a list of the adapters that are supported by SAS IT Resource Management, see Supported Adapters.
-
For more information about user-written staging code, see User-Written Staging Transformations.
-
For more information about the staging transformations that are available for the supported adapters, see About Staging the Data.
-
-
After the raw data is staged, it can be input to the aggregation step. An aggregation is the act or process of grouping data, using an operation that produces a statistic such as a sum, average, minimum, or maximum. The term aggregation can also refer to the grouped data that results from such an operation. Aggregation transformations can generate summarized aggregated tables or simple aggregated tables.Jobs that contain Aggregation transformations are created and updated in SAS Data Integration Studio.An Aggregation transformation can contain multiple aggregations that each generate an aggregation table of data. SAS IT Resource Management provides the ability to customize Aggregation transformations based on a site's requirements. An Aggregation transformation can be customized to perform aging and filtering of the aggregated data. It can perform calculations that create additional columns of data and join columns from different tables. It can support summarizations of data into any choice of time periods. The Aggregation transformation can also compute statistics on the data, calculate percent of change of a statistic over a specified period of time, and calculate the rank of a statistic or a class or ID column.An unlimited number of aggregations can be created for each staged table. For example, the same data source can be input to both a daily aggregation and a weekly aggregation within the same or separate Aggregation transformations. For more information about working with Aggregation transformations and aggregation tables, see About Aggregation Tables.
-
For a supported adapter, SAS IT Resource Management generates transformations that create information maps that reference the tables of data that are generated by that adapter's Aggregation transformations. Information maps provide clearly labeled references for all data fields that are used to create and view reports. Information maps can be used in SAS Enterprise Guide and SAS Intelligence Platform applications such as SAS Web Report Studio in order to generate reports that provide domain intelligence about the adapters, such as CPU utilization, threshold analysis, and peak period analysis.For more information about working with Information Map transformations to create and customize information maps, see About Information Maps.
-
SAS IT Resource Management generates tabular and graphical reports from report definitions that are supplied with the software, or created in SAS Enterprise Guide. Report definitions can be accessed by the Gallery transformation and, when the job that contains that Gallery transformation is run, the reports are generated and stored on the SAS Content Server. Report jobs are usually run in batch mode.
-
Reports that are generated by running the Gallery transformation are stored on the SAS Content Server where they can be accessed and managed by Gallery Manager. Gallery Manager enables information consumers to organize their reports into galleries and to set accessibility controls on those galleries. Galleries can be marked as private (for an individual's use) or public (for use by all Gallery Manager users.) Galleries can also be filtered so that they display only a subset of the available reports.
Information consumers
and performance analysts can also use these additional processes:
-
SAS Add-In for Microsoft Office enables SAS functionality to be accessed directly from the menus and toolbars of Microsoft Office word processing and spreadsheet products.Performance analysts and information consumers who frequently work with Microsoft Office products such as Microsoft Word and Microsoft Excel can use SAS to access, analyze, and report on IT performance data that is available in information maps, and then distribute the results to other people in the enterprise.